Introduction to Signals and Systems Analysis
- Kamran Jalilinia
- kamran.jalilinia@gmail.com
- 15min
- 659 Views
- 0 Comments
What is a Signal?
One of the definitions of ‘signal‘ in the Merriam-Webster dictionary is: “A detectable physical quantity or impulse (as a voltage, current, or magnetic field strength) by which messages or information can be transmitted from a source to a destination.”
A signal is simply a function, i.e., a mathematical relationship in which the values of a single dependent variable are determined by the values of independent variables. Generally, the independent variables could be time (e.g. in speech signals), space (e.g. in image data), and so on. Also, dependent variables could be like the voltage of a transistor’s collector, light intensity, etc. We are usually interested in using a physical variable not just at a single time, but rather at a set of times. In this case, the signal is a function of time, say f(t). For example, f(t) might denote voltage levels in some instants of time.
In electronics, a signal is an electrical quantity or effect, such as voltage, current, or electromagnetic fields that can be varied in such a way to convey information. The information can be recorded, conveyed, displayed, or manipulated. Electrical effects which do not convey usefully or wanted information are called noise. For this reason, one of the main criteria for the performance of a system is to measure its signal-to-noise power ratio (SNR).
There are many examples of signals including temperature, pressure, sound waves, such as speech and music, electromagnetic waves, such as radio signals, and biomedical signals, such as the electroencephalogram (EEG) and electrocardiogram (ECG).
Obviously, most of the signals are not originally in the electrical form; like temperature variations or mechanical displacement. A transducer is a device that converts a signal from one form of energy into another. For example, microphones and speakers alter pressure variations into electric voltages and vice versa. Transducers that produce electrical signals for applications in the areas of measurement and control are usually known as sensors. Examples of sensors are solar cells which convert light energy into electric voltage or thermistors which transform heat energy into electrical resistance.
In practice, the amplitude of most signals varies with time. In electronics and related fields, the waveform of a signal is the shape of its amplitude as a function of time, i.e., by plotting the amplitude on the vertical axis (y) and time on the horizontal axis (x). The waveform of an electrical signal can be visualized in an oscilloscope or any other device that can capture and plot its values at various times, with a suitable scale in the time and magnitude axes.
An electrical signal whose amplitude does not change with time over the duration of its measurement is called a direct current (DC) signal. Although most practical signals are time-varying. If the shape of the corresponding plot happens to be a sine wave, then the signal is called a sinusoidal signal. Sine waves can be considered to be the building blocks of many other signals. Figure 1 shows examples of signal waveforms as functions of time.

Signal Processing
Signal processing techniques focus on analyzing, modifying, and synthesizing signals such as sound, images, or scientific measurements. Examples of systems that manipulate signals by these techniques are speech recognition, video streaming, cellular networks, and medical scans such as MRI.
Signals are processed for a variety of reasons, such as to remove unwanted noise, correct distortions, to make them suitable for transmission, or extract certain meaningful information. Filtering is one of the most basic and important signal processing techniques; like designing signal filters based on using op-amps and discrete components of resistors, capacitors, and inductors.
Historically, signal processing was performed entirely in the analog domain. Since the late 20th century, signal processing has necessarily transitioned to the digital domain.
A signal is said to be periodic in time if its amplitude values are repeated after equal intervals of time. A period is defined as the amount of time (mostly expressed in seconds) required to complete one full cycle. This means a periodic signal repeats its pattern over sequential periods. Formally, a function f(x) is periodic with period ‘T’ (where T> 0) if:

The most famous periodic signals are trigonometric functions, like sine and cosine waves. Figure 2 shows a periodic sine wave, f(t), with period ‘T’ which is the time interval between 2 positive peaks.

The frequency of a periodic function is the number of complete cycles that occur per second. Frequency can be defined in terms of the period, as follows:

Frequency has the units of hertz (Hz) or ‘cycle per second.
This sinusoidal waveform can be defined by the function in Equation 3:
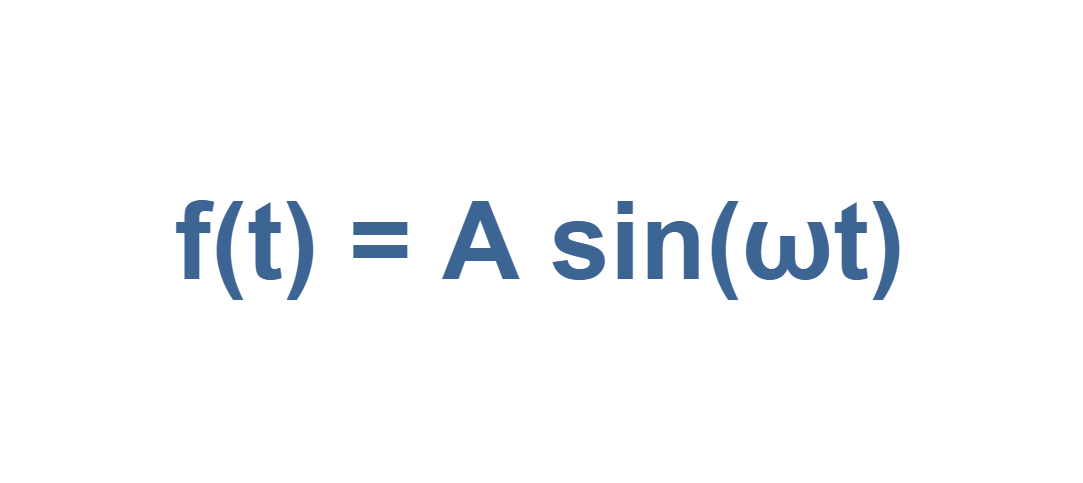
Here ‘A’ is the maximum amplitude or the peak value of the signal f(t).
The angular (or rotational) frequency (ω) measures angular displacement per unit of time. Its units are degrees (or radians) per second. It is defined in Equation 4:
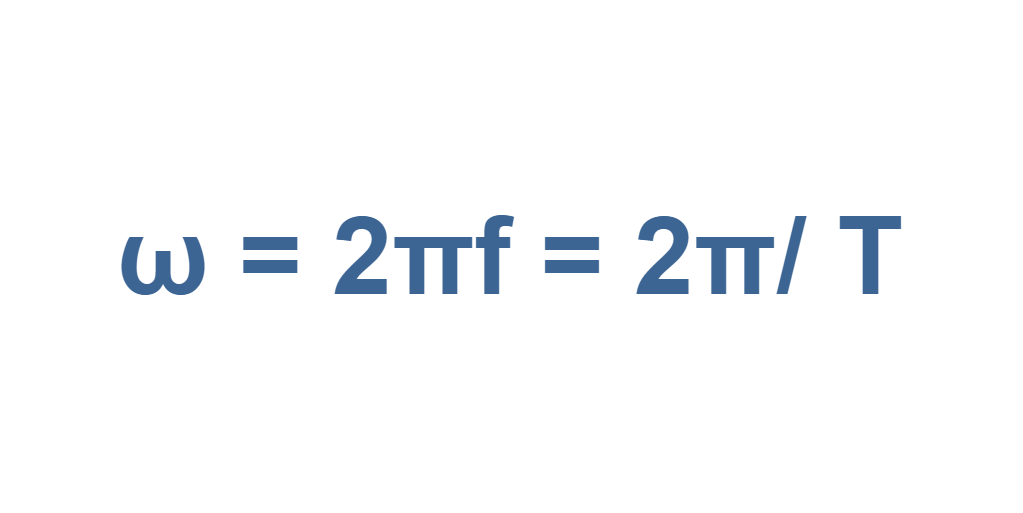
Equation 4 implies that f(t) repeats itself for all time, with a repetition period T (= 2π/ ω).
Because, the alternating current (AC) is defined as an electric current whose direction is reversed periodically and its magnitude is changed continuously with time, periodic signals are mostly called AC signals. The usual waveform of AC signals in most electric circuits are sine waves, whose positive half-period corresponds with the positive direction of the current and the negative half-period corresponds with the negative direction of it.
Obviously, no real signal goes on forever, but Equation (3) could be a reasonable model for a sinusoidal waveform that lasts a long time compared to the period of T. Thus, AC steady-state circuit analysis depends upon the assumption of an eternal sinusoid.
Figure 3 illustrates waveforms of some other famous periodic signals.

Any signal that is not periodic is called aperiodic or non-periodic. A non-periodic function does not remain self-similar for multiples of its period. Most of the real Signals that carry information, such as speech, music, or video, do not repeat endlessly. The waveform of Figure 1 (a) is an example of a non-periodic signal. Figure 4 also shows a single rectangular pulse shape wave used in radars as another example of a non-periodic waveform.

Time Domain and Frequency Domain Representation
Since time flows continuously and irreversibly, it is natural to describe sequential signal values as given by a time arrangement. By measuring amplitude values of signals at different time instants, we can monitor how the signal has changed with the passage of time. A plot of these results is known as the time-domain representation of the signal. The above-mentioned waveforms in figures 1 to 4 were all examples of representation in the time domain.
For better analysis of signal characteristics, we might be interested in measuring the quantity as a function of frequency rather than time. There are certain applications that frequency-domain representation that is very useful. This representation is also known as the spectrum of the signal.
We can study the spectrum to determine which frequencies are present in the input signal and which are present or missing in the output, which means the frequency-domain signal analysis. Then, it is possible to add or subtract frequencies to the original signal, i.e., the frequency-domain signal processing method.
As a general description, consider an example of the familiar AC waveform as a cosine function of v(t) which is plotted in Figure 5.

By convention, we can describe the cosine function by a general expression of Equation 5:
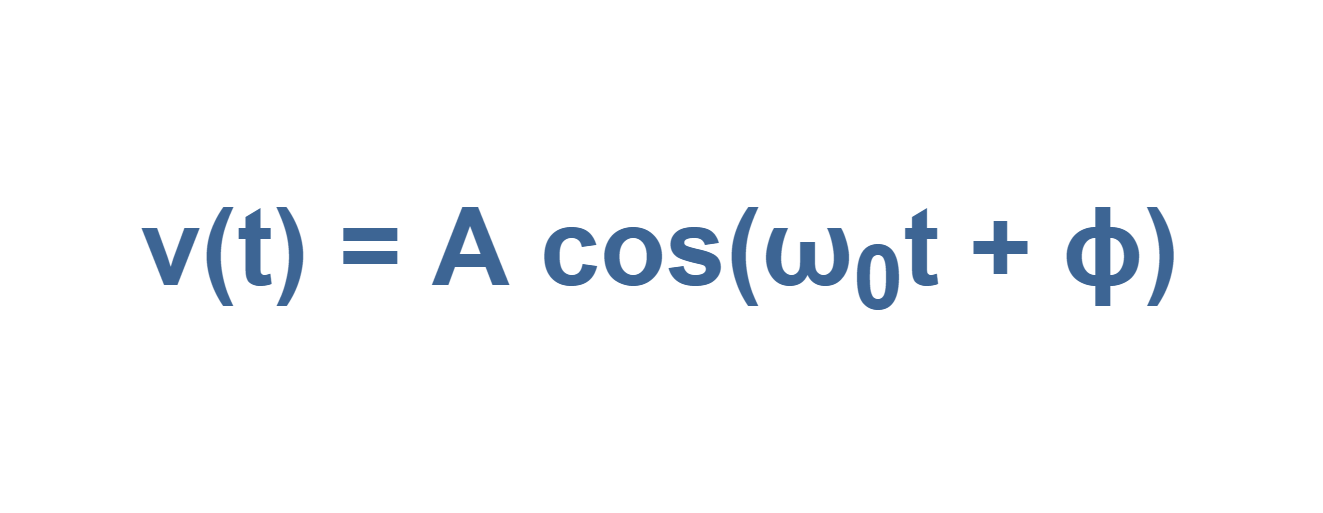
where ‘A’ is the peak of the signal and the phase angle ϕ represents the fact that the peak of the waveform has been shifted away from the time origin and occurs at (t = -ϕ/ω0). In Equation 5 both the arguments (ω0t) and the phase angle (ϕ) can be in radians or degrees.
Sinusoids are easily expressed in terms of phasors. A phasor is a complex representation of the magnitude and phase of a sinusoid, regardless of time dependency. A phasor can also be defined as a vector on the surface of complex numbers with the real and the imaginary axes. We can imagine that in a complex plane, as time increases, the phasor rotates on a circle of radius ‘A’ at an angular velocity ω0 (= 2πf0) in the counterclockwise direction. Figure 6 depicts the concept of angular frequency and phasor.

Only three parameters can completely specify a phasor: amplitude, phase angle, and angular frequency. To describe the same phasor in the frequency domain, we must associate the corresponding amplitude and phase with the particular frequency f0. By applying the phasor concept, a real function of v(t) in the time domain is converted to a complex number V(ω) in the frequency domain.
A suitable frequency-domain description would be the line spectrum shown in Figure 7, which consists of two plots: amplitude (of phasors) versus frequency and phase angle (of phasors) versus frequency.

In this line spectra illustration, we regard amplitude as always being a positive quantity. When negative signs appear, they must be absorbed in the phase angle using the next equation:

The amplitude spectrum essentially conveys more information than the phase spectrum and it displays the signal’s frequency content, i.e., the amplitude spectrum tells us what frequencies are present and in what proportion. Drawings like Figure 7, called one-sided or positive-frequency line spectra, can be constructed for any linear combination of sinusoids.
Figure 8 shows the illustration of a sawtooth wave shape signal in time and frequency domains. In both illustrations, the y-axis represents the amplitude of the signal. Each of them presents the same phenomenon from different viewpoints.

In Figure 8, the frequency-domain graph clearly shows that a sawtooth wave is a combination of many sine waves (with a line spectrum for each wave), which are all harmonics of the main sine wave with a fundamental frequency of f0. As the frequency of harmonics increases, the corresponding amplitude of line spectra decreases.
Representing the time-domain waveform in Figure 8 could be similar to displaying a signal on an electronic oscilloscope measurement device. On the other hand, looking from the frequency-domain viewpoint in Figure 8 is similar to monitoring the signal on a spectrum analyzer device which can show us information about the amplitude or power of frequency components.
Types of Signals: Continuous and Discrete
A continuous-time signal is a signal defined over a continuous range of time and its amplitude may have a continuous range of values (analog signal) or only a finite number of distinct values (quantized signal). The distinct values are called quantized values and they can be changed only by a set of distinct steps of magnitude.
Most of the signals naturally occurring in the world are analog and they provide a continuous stream of information on the physical quantity they represent. The main characteristics of analog signals are amplitude, frequency, and phase. The best example of an analog signal is a human’s voice.
A discrete-time signal is a signal defined only at discrete instants of time i.e. the independent variable of time (t) has been quantized. In a discrete-time signal, if the amplitude has a continuous range of values, the signal is called a sampled signal. In this case, if the amplitude contains a set of discrete values, the signal is usually called a digital signal.
In past decades, analog computers employed physical quantities that were approximations of continuous representations of signals. While discrete representations of both time and amplitude are necessary for digital computers in present decades.
If we consider both important variables of time and amplitude, which are essential to represent any type of signal, the categories can be expanded to 4 items:
- (a) continuous-time with continuous amplitude (analog signal)
- (b) continuous-time with discrete amplitude (quantized signal)
- (c) discrete-time with continuous amplitude (sampled signal)
- (d) discrete-time with discrete amplitude (discrete/digital signal)
Figure 9 shows an example for each of the categories. It is worth mentioning that in the case of discretization of signal in time, the variable of time (t) is usually replaced by the number of time intervals between amplitude samples and it is denoted by ‘n’.

Summary
- The term analog signal processing describes a body of techniques that can be implemented to process analog (or real-world) signals.
- This includes the theory and application of filtering, coding, transmitting, estimating, detecting, analyzing, and reproducing analog signals.
- The frequency f is in units of Hertz (abbreviated Hz) which is sec-1, or often called cycles per second.
- ω is also the frequency in terms of radians/sec units and is known as radial or circular frequency. f and ω are related by ω = 2πf.
- This is very useful in many applications to find the behavior of the signal in terms of time units. When we can monitor how the signal has changed with the passage of time, we call this the time-domain description of a signal.
- A frequency-domain description uses some set of sinusoidal signals as a basis for describing a signal.
- The observer can look at the amplitude variations of the signal from the time-domain or frequency-domain point of view.
- The term periodic signal is usually applied to periodically varying voltages, currents, or electromagnetic fields.
- The opposite of a periodic signal is an aperiodic signal. An aperiodic function never repeats.
- Frequency-domain signal descriptions decompose the source signals into sinusoidal components. The frequency of the sinusoid that most closely matches the signal is the principal frequency component of the signal.
- Non-periodic signals can also be represented in the frequency domain.
- Signals can be categorized in continuous or discrete types, in amplitude or time.
More tutorials in Systems
- The Fourier Analysis –The Fast Fourier Transform (FFT) Method
- The Fourier Analysis – Discrete Fourier Transform (DFT)
- Analog To Digital Conversion – Performance Criteria
- Analog To Digital Conversion – Practical Considerations
- Analog To Digital Conversion – Decoding Signals
- Analog To Digital Conversion – Binary Encoding
- Analog To Digital Conversion – Sampling and Quantization
- The Fourier Analysis – Fourier Transform
- The Fourier Analysis – Fourier Series Method
- Introduction to Signals and Systems Analysis


