Choosing the right capacitors can make a big difference in the reliability, longevity, cost, and board size of your design. But most engineers don’t know which capacitors to choose for which applications. In this episode of Chalk Talk, Amelia Dalton chats with James Lewis from KEMET about the fascinating and surprising world of capacitor technology.
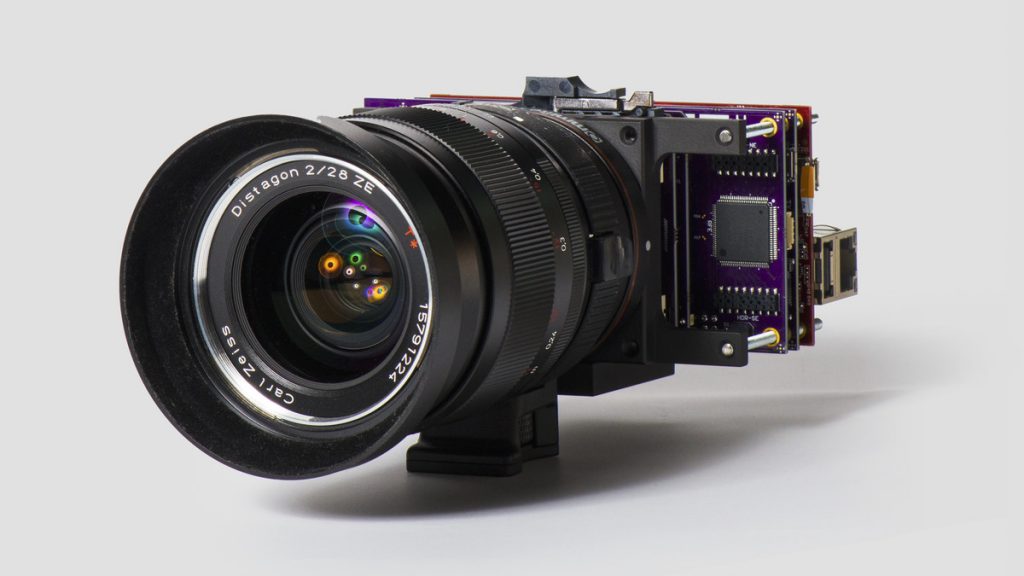
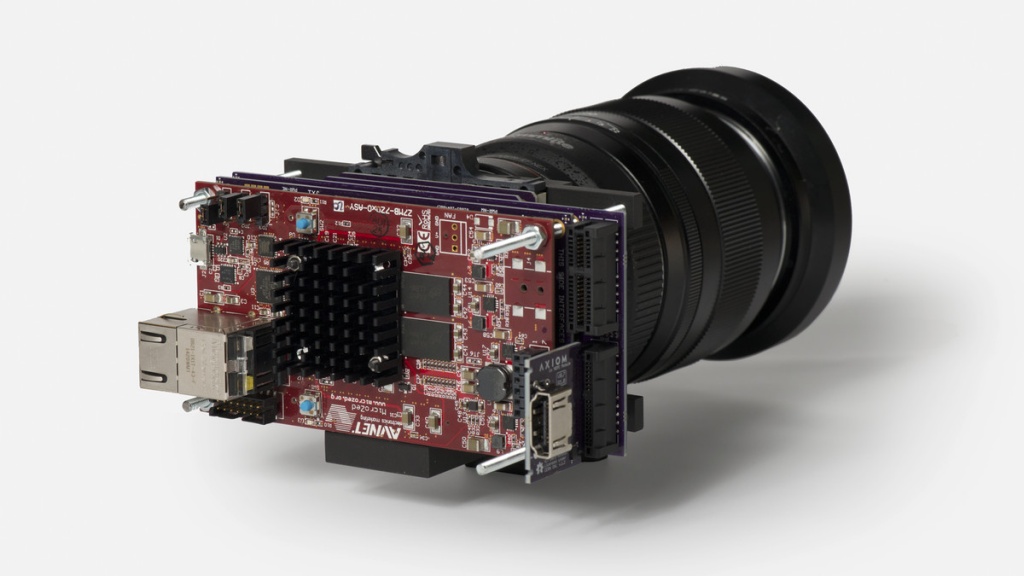
Apertus AXIOM Beta is a professional digital cinema camera built around free open source software and hardware. AXIOM Beta is the latest version powered by MicroZed development board based on Xilinx Zynq 7020 ARM + FPGA SoC, and running Arch Linux ARM. The camera will run Arch Linux ARM on MicroZed board, support common network protocols (SSH/FTP/SCP/etc), and be configurable via a web interface. It has many interesting specification as listed below, however audio recording is not currently supported. Many more software and hardware details can be found in their Wiki.
AXIOM Beta developer kit hardware specifications:
“Linux” Board – Xilinx Zynq 7020 based MicroZed board
Beta Main Board – Hosts two external medium-speed shield connectors and two high-speed plugin module slot connectors.
Image Sensor – 12MP CMV12000 (Used for research and development) via CMV12K ZIF Sensor Board
Lens Mount Passive E-mount
Ports – USB / USB UART / JTAG / Gigabit Ethernet
Modules and Shields
Single HDMI Full HD (4:4:4) output at up to 60 FPS
Dual 6G SDI output (in development)
3x PMOD debug module
LED matrix debug module
Genlock, Trigger, Timecode, LANC shields (in development)
4K Displayport/HDMI (in development)
Power Supply – 5V/5A via power adapter board; Other voltages provided via Beta Power Board
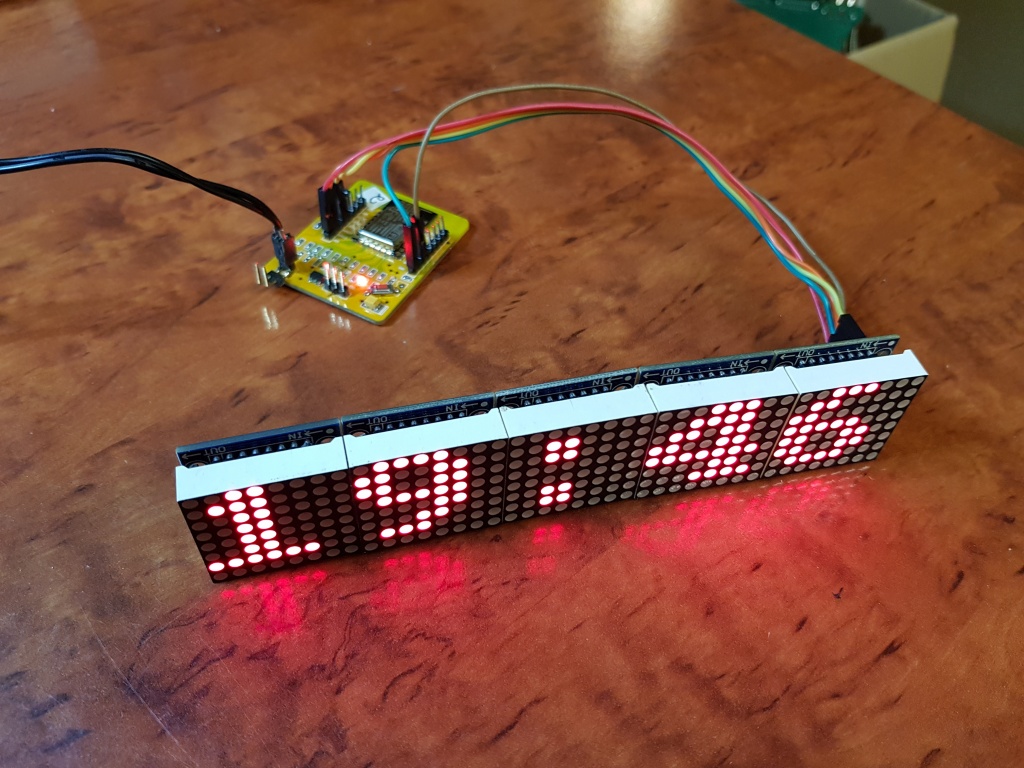
A MAX7219 driven Display, controlled by an ESP8266 SoC and MQTT
This project describes how to connect a MAX7219 to an ESP8266 Chip and let it act as a MQTT client. Its basically my ninHOME Node Firmware where you can optionally add a MAX7219 Display.
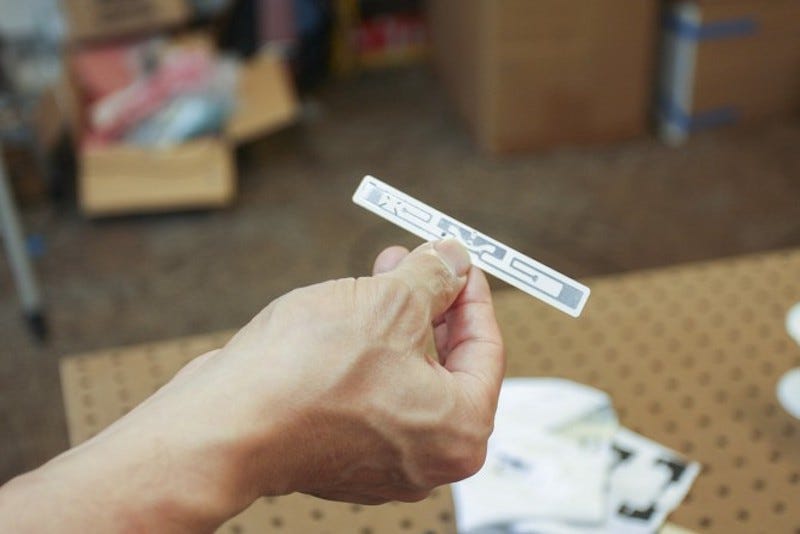
Engineers at Cornell university have created a new system for measuring vitals, which could revolutionize hospital experience for everybody. Usually, getting sick means having to go to the hospital which because of today´s procedures takes almost all your day (if not more), and most of the time is spent in waiting rooms. What if you could be “attended” while still in the waiting room? Because of RFID technology this is now possible with a device that can measure your vitals while you wait.
RFID (short for radio frequency identification) uses electromagnetic fields to track and identify tags attached to objects. Passive tags collect energy from a nearby RFID reader (they don’t require a battery) and can operate several meters away. The signal from the reader induces a small electric current enough to operate the CMOS of the tag.
This new system uses cheap sensor that don’t require their own power supplies, while the reader powers them and gathers data wirelessly. These tags are applied to the skin, and using radio waves they can measure blood pressure, breath rate, heart rate etc. The reader can gather data from hundreds of these tags at the same time, and they are cheap to produce. Nowadays, the price of the tags depends on memory, type of packaging and the volume of tags requested, but passive tags cost around 7 to 15 U.S cents.
As a result, not only waiting times could be shortened, but the work of many doctors and nurses could be lightened. Currently, monitoring vitals takes a lot of equipment which is expensive and big. With this new technology, big and not practical equipment will be no longer needed, and the work done by many devices will be done by a small sticker with the size of a finger or smaller.
In the beginning RFID had security issues because anyone could access the information on the tags, but nowadays security protocols have been implemented to encrypt and protect users data. This makes this device not only practical and affordable, but also safe and private.
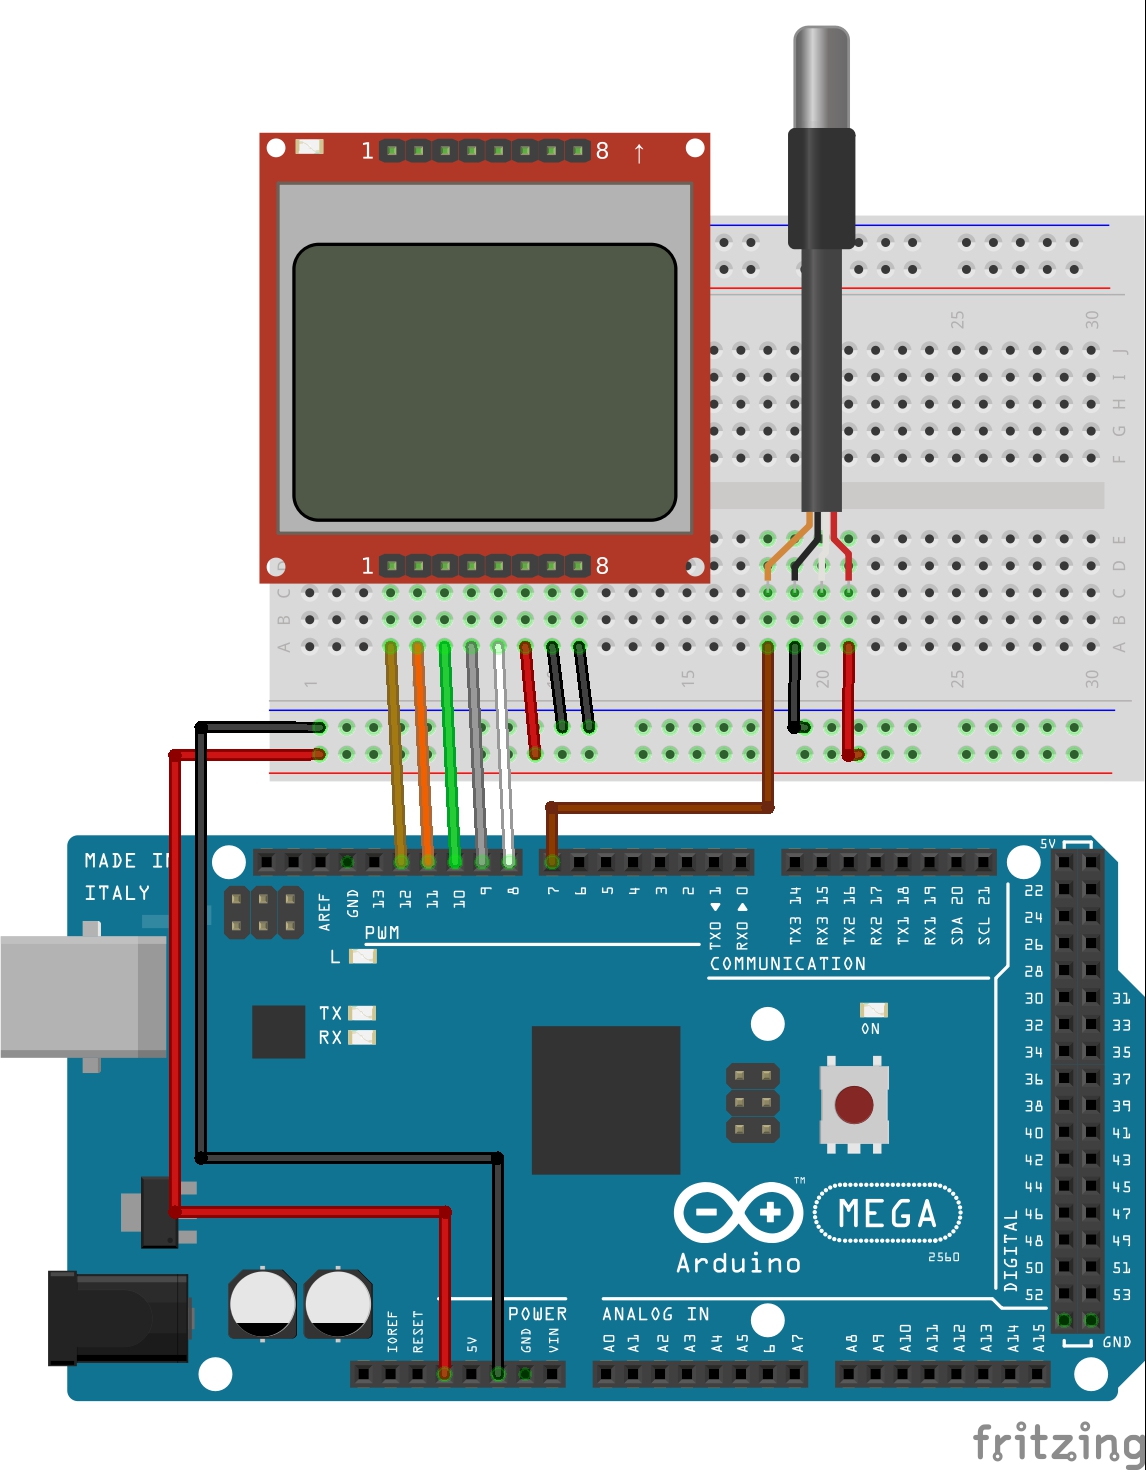
Hi guys welcome to this tutorial. Today we will be building a simple temperature monitor using the DS18B20 sensor with a Nokia 5110 LCD Display and an Arduino mega.
The DS18B20 digital temperature sensor gives a 9-bit to 12-bit Celsius temperature readings and also has an alarm function with nonvolatile user-programmable upper and lower trigger points. The sensor communicates via the 1-Wire communication protocol and thus by definition requires only one data line (and ground) for communication with a central microprocessor. Among the special features of this sensor, is an operational mode in which it can derive power directly from the data line (“parasite power”), eliminating the need for an external power supply line.
DS18B20 Sensor Based Thermometer with Nokia 5110 LCD display – [Link]
Hi guys welcome to this tutorial. Today we will be building a simple temperature monitor using the DS18B20 sensor with a Nokia 5110 LCD Display and an Arduino mega.
Introduction
The DS18B20 digital temperature sensor gives a 9-bit to 12-bit Celsius temperature readings and also has an alarm function with nonvolatile user-programmable upper and lower trigger points. The sensor communicates via the 1-Wire communication protocol and thus by definition requires only one data line (and ground) for communication with a central microprocessor. Among the special features of this sensor, is an operational mode in which it can derive power directly from the data line (“parasite power”), eliminating the need for an external power supply line.
DS18B20 Temperature sensor
Each DS18B20 has a unique 64-bit serial code, which allows multiple DS18B20s to work on the same 1-Wire bus. Thus, it is simple to use one micro-controller to control many DS18B20s distributed over a large area. Some applications that can benefit from this capability include HVAC systems, temperature monitoring systems inside buildings, equipment, or machines, and process monitoring and control systems.
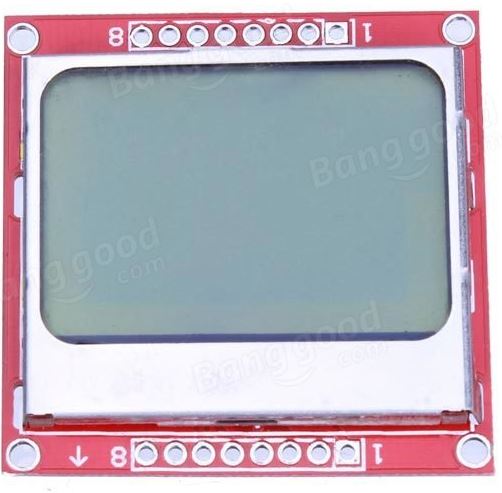
The Nokia 5110 was used to provide a feedback on the temperature values to the user but the Arduino serial monitor may also be used for those who do not have the display and the code for this is also included.
Nokia 5110 LCD Display
A more detailed tutorial on using the Nokia 5110 LCD display can be found here.
Required Components
The following components with links attached to where they can be bought are needed for this project:
The first library is the one-wire Arduino library. The one-wire Arduino Library allows one-wire enabled devices to communicate over the one-wire protocol with Arduino microcontrollers. On the 1-wire network which is also referred to as a “MicroLan” (trademark), a single “master” device communicates with one or more 1-Wire “slave” devices over a single data line, with an added perk of the same data line serving as power line for the sensor in a mode known as “parasitic” Mode. This means that we can connect multiple DS18B20 temperature sensor on the same Arduino pin (saving a whole lot of IOs).
The second library we will need is the Miles Burton Arduino temperature control library.
The Arduino temperature control library was created to make it easy to get temperature information from the Maxim Integrated temperature sensor.
Install these libraries with the Arduino by unzipping and copying to the location on your PC location where you have the Arduino libraries.
With this done, we are then ready to program our Arduino to read the temperature sensor.
We will be making two codes available for this project;
SerialTemperature.ino
TemperatureNokia5110.ino
The first one (SerialTemperature.ino) displays the data over the Arduino serial monitor so that people who do not have the Nokia 5110 LCD display can also follow the tutorial by viewing the temperature data via the serial communication port.
The second code (TemperatureNokia5110.ino) is for those who have the Nokia 5110 lcd display.
Each of the codes will be explained differently to cover all the angles involved.
Let’s start with the first one.
Serial Temperature
The first thing we do is include the libraries we downloaded earlier.
//Written by Nick Koumaris
//Info@educ8s.tv
//educ8s.tv
#include <OneWire.h>
#include <DallasTemperature.h>
Next, we declare the pin to which our temperature sensor’s signal pin is connected, after which, the one wire method is called.
Next we need to declare the variables for holding the temperatures both in farenheit(TempF) and in degrees(TempC).
With this done, we then move to the setup function and startup the serial monitor with 9600 as the baud rate and also issue the command sensors.begin, which starts up communication with the temperature sensor via 1-wire.
Next we go into the void loop function. The void loop function contains three main lines. The first line reads the temperature from the temperature sensor. using the sensor.requestTemperatures() function. After this, the temperature in degrees Celsius is acquired using the second line. The index “0” is what needs to be changed to either 1 or 2 or N when you have multiple sensors on the 1-wire line.
With the temperature in Celsius gotten, the next line of code then obtains the temperature in Fahrenheit and its all then formatted to be nicely displayed by the printTemperature() function.
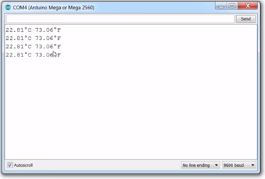
Copy, paste in the Arduino IDE and upload to your board. You should see outputs on your serial monitor like the image below.
Serial Output
All done, it is time to take a look at the code for those who have the Nokia 5110 LCD display.
Temperature with Nokia 5110 LCD Code
There are two sides to the code for this. The first one is the temperatureIcon.c file which is essentially the binary data representing the Icon that was used on the LCD.
The second file is the TemperatureNokia5110.ino file which contains the actual arduino code which I am about to explain.
Just like for the serial version of this code, we import the necessary libraries. In this case, we have to add the LCD library.
//Written by Nick Koumaris
//info@educ8s.tv
//Educ8s.tv
#include <OneWire.h>
#include <DallasTemperature.h>
#include <LCD5110_Graph.h>
with this done, a 1-wire object is created and other variable declarations needed for both the screen and the sensor are handled.
With this done, we then proceed to the setup function where we, initialized the LCD, set its display font and then start communication with the sensor.
Setup all done? we then move to the Loop section. The first function in the loop section clears the LCD screen, after which the Icon is drawn using the draw bitmap function. After the bitmap is drawn, then the all familiar functions to read the temperature both in Celsius and Farenheit and display on the LCD.
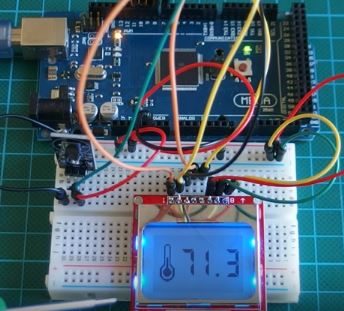
That’s it guys, you know the drill. Copy and paste in the Arduino IDE and upload to your board. You should see an output like what is in the Image below.
Demo
That’s it guys, thanks for sticking around for this one. If you have questions or comments, do drop them in the comment section and I will respond as soon as possible.
The youtube video for this tutorial can also be found here.
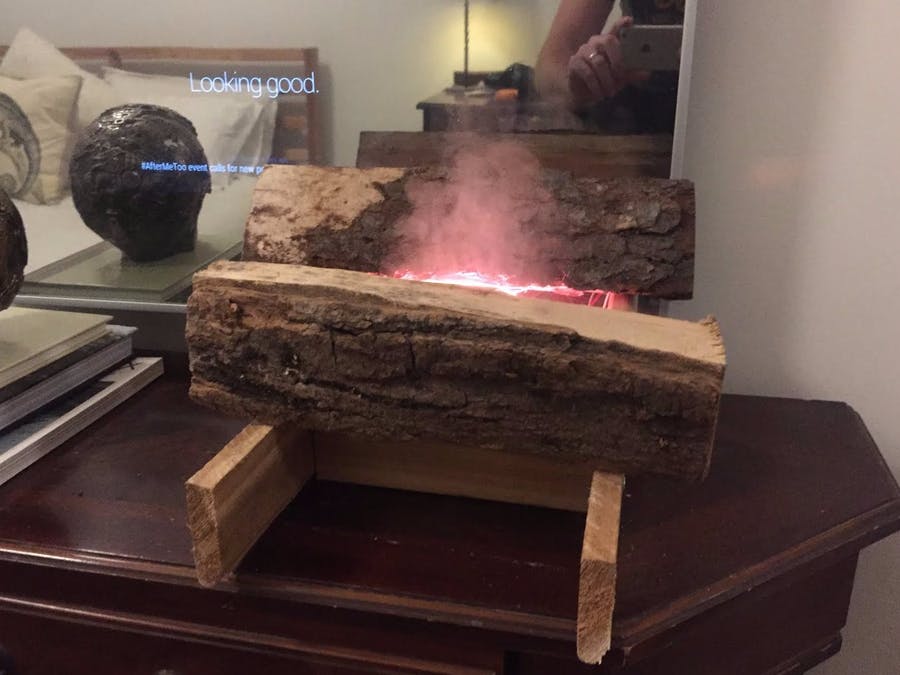
A convincing artificial fire effect for the holiday season, using NeoPixel LEDs, an Arduino UNO, and a cool mist module.
The instructions for this are actually pretty simple, basically you just need to get the materials, and put them all together. The only technical part is soldering the wires onto the NeoPixel stick, and uploading the code to the Arduino. So let’s start with the NeoPixel LEDs.
Imitation Fireplace Using Cool Mist and LEDs – [Link]
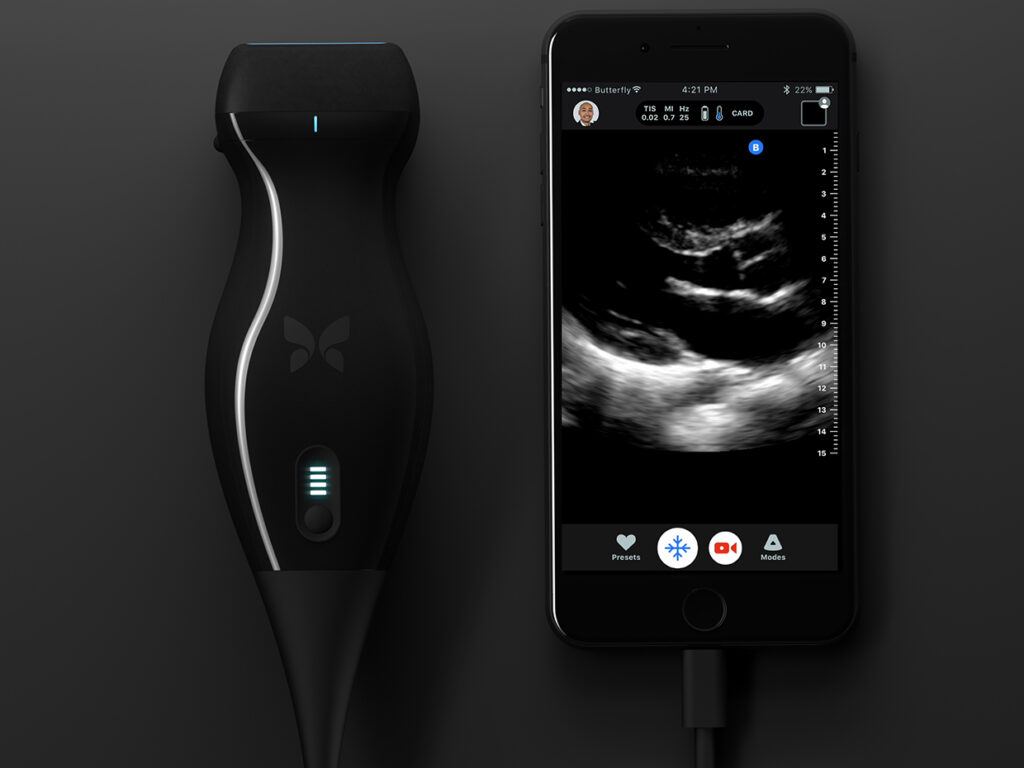
Ultrasound, also known as sonography, is a medical procedure which uses sound waves to get images from inside the body. It is used to help guide biopsies, diagnose causes of pain, examine a baby in pregnant women, diagnose heart conditions etc. High- frequency sound waves are transmitted to the body using a small transducer (probe), then the probe collects the sounds that bounce back, and a computer uses that information to render an image. Ultrasound scanner consist of a transducer, a video display, a console (with computer and electronics) and sometimes multiple transducers are needed for different parts of the body. As a result, ultrasound machines are not portable, and are not easy to access during emergencies.
As a result, Butterfly has combined semiconductor engineering, artificial intelligence, and the cloud in order to create IQ, a portable and affordable ultrasound machine. Butterfly believes that “Medical imaging should be accessible to everyone on the planet”. With the use of a chip, a single probe, and an iPhone now every licensed healthcare practitioner can have an ultrasound anywhere, anytime.
The chips used for the device has transducers, signal processing and computational horsepower. Also, the device has its own battery (to avoid draining the phone’s battery), and works with 9,000 little drums that wobble to create sound and then receive it from the body. It does all the signal processing that would normally cost a hundred thousand dollars to render an image.
Nowadays, ultrasound machines use piezoelectric crystals which require on factory tuning for specific depths which generates the need for multiple probes. The IQ can be tuned on the go and can be buzz at 1 MHz for deep analysis or 5 MHz for shallow analysis. Additionally, the Butterfly IQ incorporates artificial intelligence for image acquisition and analysis which in the future could help guide nonprofessionals in proper operation of the device. Also, it includes cloud services for storage.
This device already has FDA clearance for 13 clinical applications which include abdominal, cardiac (adult and pediatric), fetal (obstetric), gynecological and procedural guidance. The same probe can be used to look anywhere inside the body, with different depths and to anyone.
Eventually, Butterfly expect their device to become as accessible and useful as a household thermometer, but currently it is not available for consumers and the price is high for household purposes. Its only supported by iPhone (soon by iPad), but there has been no talk about Android support. The price starts in 2K and shipping will begin on 2018.
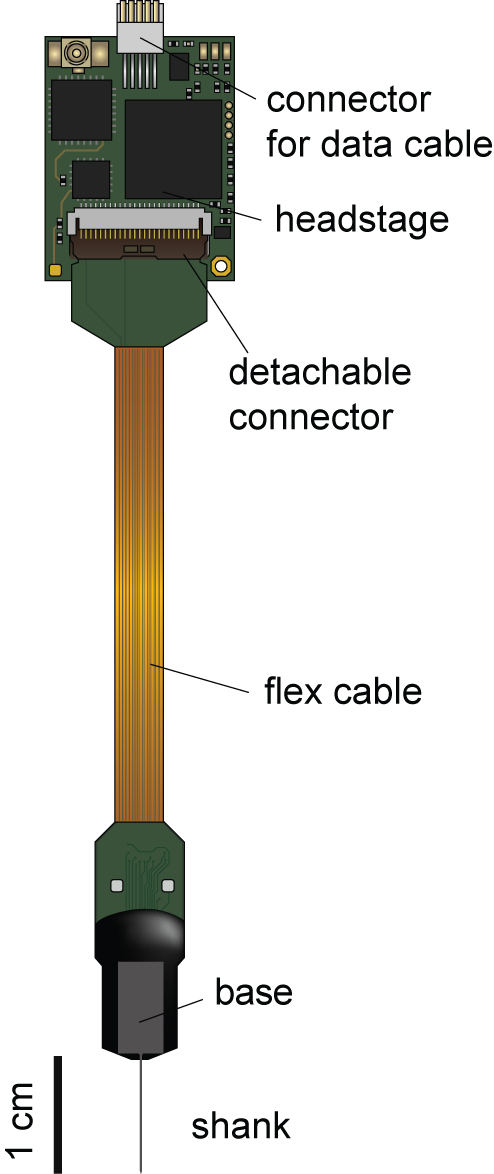
After $5.5 millions collaboration and a lot of work during the past four years of engineers at Imec, the next-generation electrodes called Neuropixels probe were designed to record hundreds of neurons in the brain. Imec is an international nano electronics research center dedicated to build and test powerful new devices for detecting neural activity within the brain.
To understand how the brain operates, we must measure the joint activity of a myriad individual neurons distributed across brain regions. Until recently, this has been impossible.
Their success is due to three innovations:
a multiplayer fabrication process that allows 384 interconnects on a thin shank;
on-shank CMOS circuitry that allows 384 sites to be rapidly selected from a total of 966;
on-device processing that amplifies, digitizes, and multiplexes the signals.
Neuropixels thus constitute a self-contained recording system: the data that emerge are already digital, and can be read by a simple, inexpensive interface to a standard computer.
Probe Options
There are four probe options, all four have the same on-probe amplification and digitization, and can all be used interchangeably with the same headstages and recording equipment.
Option1 probes (no switches, no amps) have 5mm-long shanks, and have no switches (they can only record from the most distal 384 sites) or on-site buffer amplifiers.
Option2 probes (no switches, yes amps) have 5mm-long shanks, and have no switches
Option3 probes (yes switches, no amps) have 10mm-long shanks with 960 total sites accessible via switches; they do not have on-site buffer amplifiers.
Option4 probes (yes switches, yes amps) have 10mm-long shanks with 966 total sites accessible via switches; they have on-site buffer amplifiers. Option4 probes can only record 276 channels at a time.
In practical terms, the probes with buffer amps (2 & 4) have slightly higher RMS noise levels in saline (~10-12µV RMS compared to 6-9) but may have superior rejection of certain types of noise.
Switched probes (3 & 4) do not seem to have any deficits relative to the un-switched, unless the shorter shank of the unswitched probes is more suitable for your experimental situation.
Basic Probe Details
Neuropixels probes have 384 recording channels (i.e. can record 384 signals simultaneously), and up to 966 recording sites (depending on the option)
Recording sites are laid out in a checkerboard pattern, see geometry note below.
10 sites per group of 384 are reserved for selection as internal reference sites and cannot be used for recording (whether they are used for referencing or not)
Recording sites have ~200k-ohm impedances
Shanks are 70µm wide and 20µm thick (for Option1, shank is 50µm wide)
Probe weighs 0.3g, headstage weighs 1.1g.
Neuropixels probes represent a significant advance in measurement technology and will allow for the most precise understanding yet of how large networks of nerve cells coordinate to give rise to behavior and cognition.
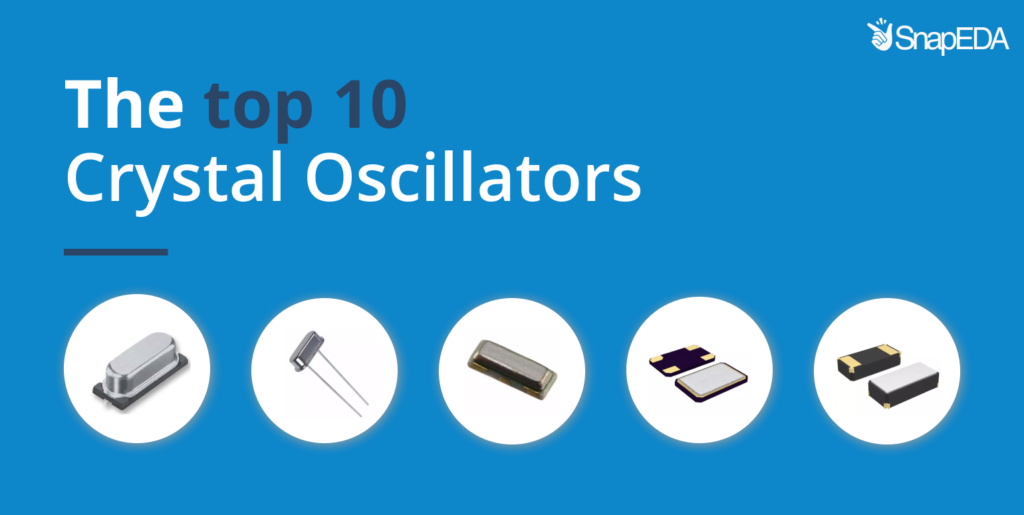
Elizabeth Bustamante @ snapeda.com lists the top 10 crystal oscillators used today. She writes:
A crystal oscillator is an electronic circuit that generates an electrical signal with a very precise frequency. To achieve this, it uses the mechanical resonance of a vibrating crystal made of piezoelectric material.
The first crystal oscillator was invented in the late 1920s by Walter Guyton Cady who was interested in submarine detection with ultrasonic waves. He suggested that a piezoelectric resonator could be used as a frequency reference, a coupling device between circuits, or a filter.
The top 10 crystal oscillators from SnapEDA – [Link]