Arduino Breathalyzer Using MQ3 Gas sensor and OLED Display

Introduction

Hi guys, Welcome to this tutorial. Today we will build a breathalyzer using the MQ3 gas sensor, an OLED display and Arduino.

A breathalyzer is a generalized trademarked name for  devices used for determining blood alcohol content from a breath sample. This means the device can detect from your breadth, the amount of alcohol you have taken. This device becomes very useful when you consider several cases of accidents caused by drunk driving. With this device, you can easily warn the driver of a car when he/she is too drunk to drive a car. It is important to note that this project is not accurate enough to replace the standard breathalyzer and you shouldn’t drink and drive.

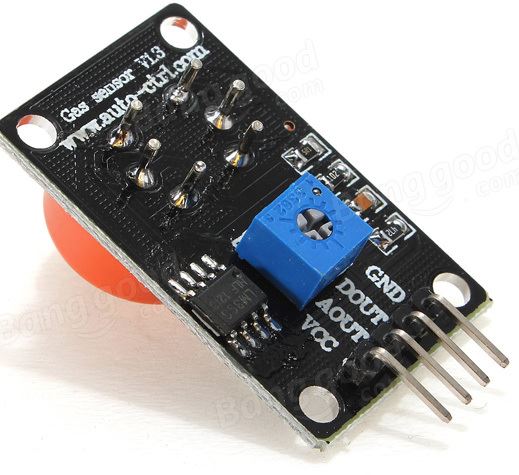
For this project, we will be using the MQ3 alcohol sensor. It is a cheap semiconductor sensor capable of detecting the presence of alcohol in air at concentrations between the value 0.05 mg/L to 10 mg/L. The sensor uses a chemical reaction to determine alcohol level and the primary sensing element in the sensor is SnO2, the conductivity of SnO2 is low in clean air but increases as the concentration of alcohol gas in air (breath) increases. It has high sensitivity to alcohol and has a good resistance to disturbances and noise from things like smoke and gasoline.

MQ-3 Alcohol Sensor

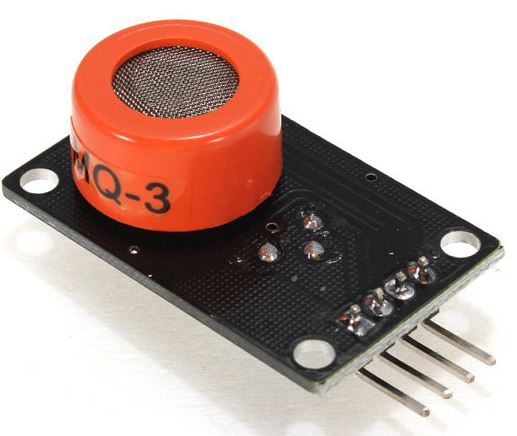
The MQ3 module has 4 pins including  both digital and analog outputs, VCC and Gnd. MQ3 alcohol sensor module can be easily interfaced with microcontrollers and development boards like Arduino Boards, Raspberry Pi etc.


MQ-3 Alcohol Sensor Pin-out

The readings from the MQ3 sensor will be displayed via the Arduino mega on an OLED display. A tutorial detailing how to use the OLED display with the arduino is available here.

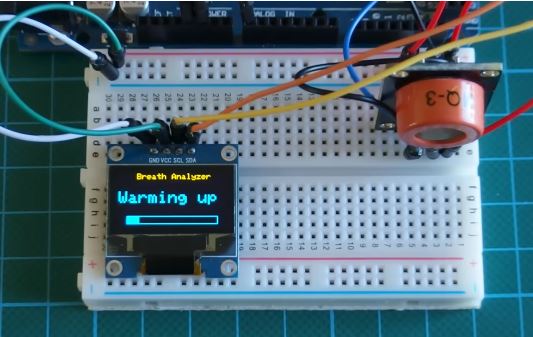
The MQ3 sensor senses alcohol in a somewhat controlled environment in the sense that the sensor only senses alcohol after heating up to a particular level. To get accurate results, it needs between 10-15 mins on power up to heat up to the desired temperature level which is usually around 40 degrees.

Warming Up

its important to note that this sensor only detects alcohol molecules in air and not liquid alcohol.

Project Parts

To dive in, here is a list of components needed for the tutorial. These components can be purchased via the attached links.

  1. MQ3 Alcohol Sensor Module
  2. 0.96′ I2C OLED display
  3. Arduino Mega (Uno or any other board type would also work)
  4. Small Breadboard
  5. Jumper Wires

Schematics

Connect all the components as shown in the schematics below.

Schematics

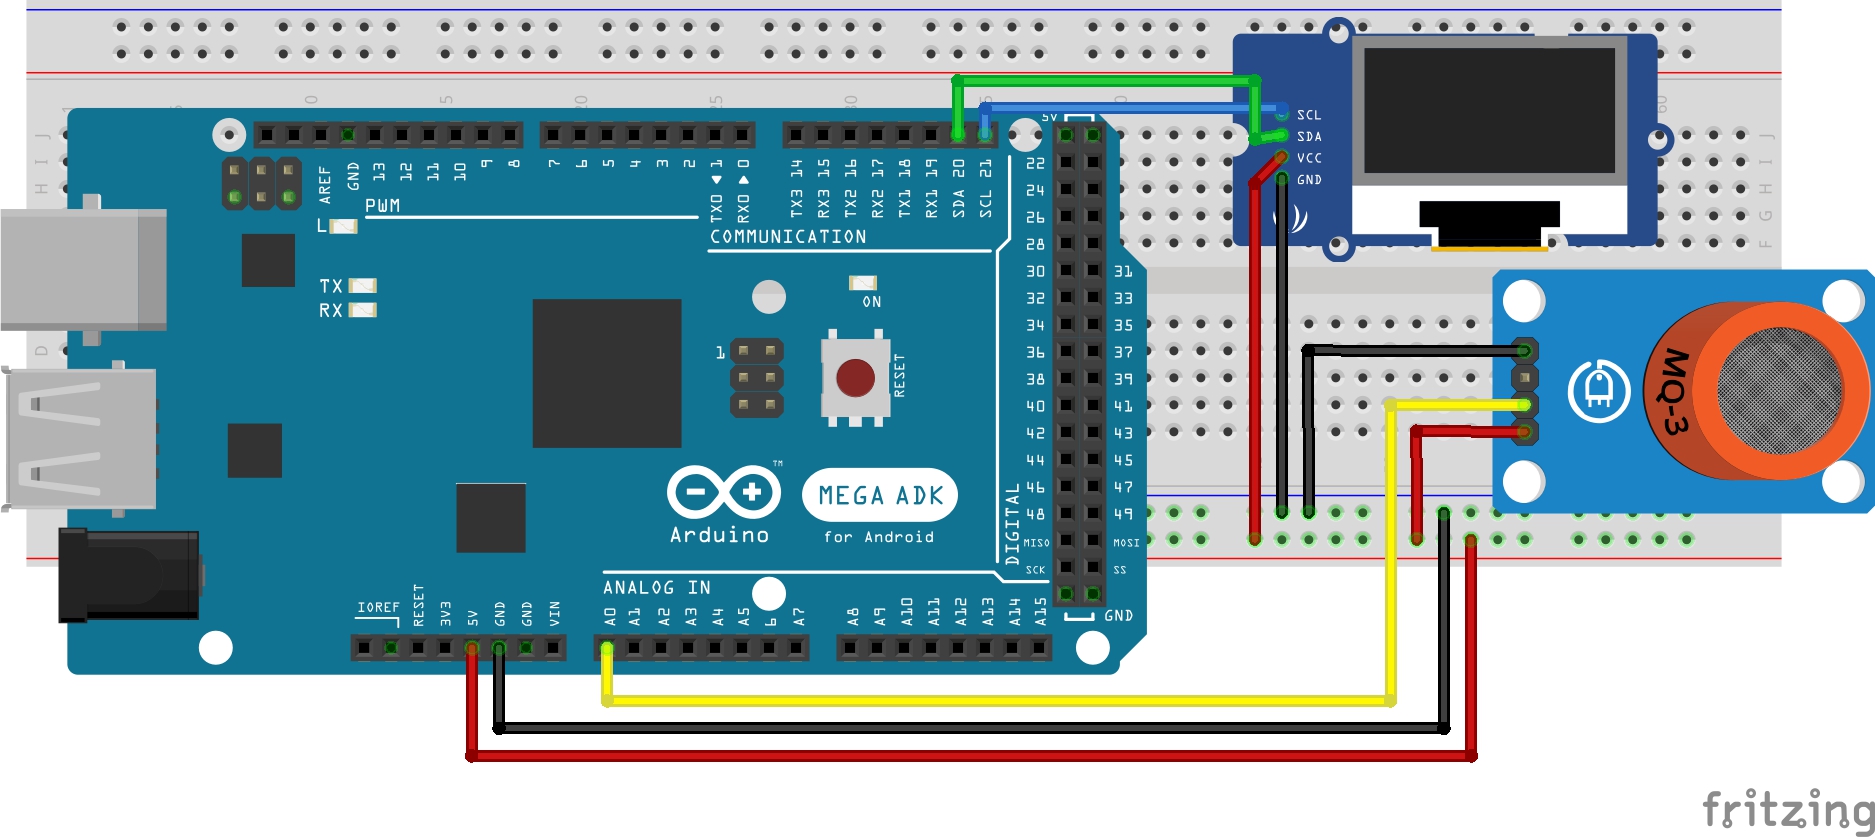
Connect the component as shown above. For clarity, the pin connections are also described below.

MQ3 – Arduino

 VCC - 5v
 GND - GND
 A0 - A0

OLED – ARDUINO

 VCC - 5v
 GND - GND
 SCL - SCL(Pin D21)
 SDA - SDA(Pin D20)

with the connections all done, we are ready to start writing the code.

Code

As usual, we will break down the code before dropping it all.

The first thing we do is include the functions which are needed for us to be able to interface the OLED display with the Arduino. more information on how the display part of this project works can be found here.

//Written by Nick Koumaris
//info@educ8s.tv
//educ8s.tv

#include <SPI.h>
#include <Wire.h>
#include <Adafruit_GFX.h>
#include <Adafruit_SSD1306.h>

We then input the wait time. Here I used 900s but you can change it to suit your needs.

int TIME_UNTIL_WARMUP = 900;
unsigned long time;

We then declare the analog pin to which our alcohol sensor is connected i.e Analog pin 0.

int analogPin = 0;

The next major part after declaring the pin is in the loop function, where we call the read alcohol function which gives us the analog value as determined by the alcohol sensor.

val = readAlcohol();

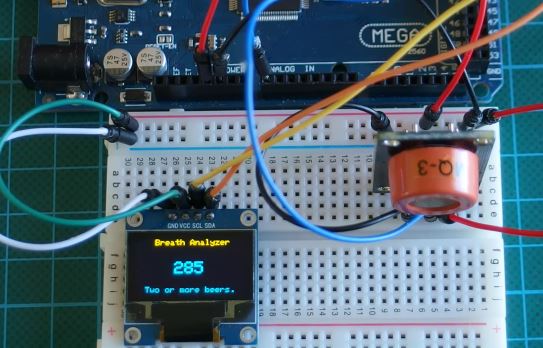
with the value stored, we then check if the device is warm and display the Analog value using the print alcohol function. We also display a message based on the analog level to say whether the owner of the breadth is sober or not.

if(time<=TIME_UNTIL_WARMUP)
 {
   time = map(time, 0, TIME_UNTIL_WARMUP, 0, 100);
   display.drawRect(10, 50, 110, 10, WHITE); //Empty Bar
   display.fillRect(10, 50, time,10,WHITE);
 }else
 {
    printTitle();
    printAlcohol(val);
    printAlcoholLevel(val);  
 }

The full code for this project is available below.

//Written by Nick Koumaris
//info@educ8s.tv
//educ8s.tv

#include <SPI.h>
#include <Wire.h>
#include <Adafruit_GFX.h>
#include <Adafruit_SSD1306.h>

#define OLED_RESET 4
int TIME_UNTIL_WARMUP = 900;
unsigned long time;


int analogPin = 0;
int val = 0;
Adafruit_SSD1306 display(OLED_RESET);


void setup()   {                

 display.begin(SSD1306_SWITCHCAPVCC, 0x3C);
 display.clearDisplay();
}


void loop() {  
  
  delay(100);

  val = readAlcohol();
  printTitle();
  printWarming();

  time = millis()/1000;
  
  if(time<=TIME_UNTIL_WARMUP)
  {
    time = map(time, 0, TIME_UNTIL_WARMUP, 0, 100);
    display.drawRect(10, 50, 110, 10, WHITE); //Empty Bar
    display.fillRect(10, 50, time,10,WHITE);
  }else
  {
     printTitle();
     printAlcohol(val);
     printAlcoholLevel(val);  
  }
  display.display();

}


void printTitle()
{
  display.clearDisplay();
  display.setTextSize(1);
  display.setTextColor(WHITE);
  display.setCursor(22,0);
  display.println("Breath Analyzer");
}

void printWarming()
{
  display.setTextSize(2);
  display.setTextColor(WHITE);
  display.setCursor(0,20);
  display.println("Warming up");
}

void printAlcohol(int value)
{
  display.setTextSize(2);
  display.setTextColor(WHITE);
  display.setCursor(45,25);
  display.println(val);
}

void printAlcoholLevel(int value)
{
  display.setTextSize(1);
  display.setTextColor(WHITE);
  display.setCursor(10,55);
  
  if(value<200)
  {
      display.println("You are sober.");
  }
  if (value>=200 && value<280)
  {
      display.println("You had a beer.");
  }
  if (value>=280 && value<350)
  {
      display.println("Two or more beers.");
  }
  if (value>=350 && value <450)
  {
      display.println("I smell Oyzo!");
  }
  if(value>450)
  {
     display.println("You are drunk!");
  }
 }
 
 int readAlcohol()
 {
  int val = 0;
  int val1;
  int val2;
  int val3; 


  display.clearDisplay();
  val1 = analogRead(analogPin); 
  delay(10);
  val2 = analogRead(analogPin); 
  delay(10);
  val3 = analogRead(analogPin);
  
  val = (val1+val2+val3)/3;
  return val;
 }

Copy the code, paste in the Arduino IDE and upload to your board. You should see something like the image below after its warm. The Arduino code is attached in a zip file at the end of the project.

Demo

That’s it for this tutorial. As usual, let me know if you have any questions or comments via the comment section.

You can watch the video of this tutorial here.

PCBite 2.0 – Hands-free & steady solution for your measurements

SensePeek launched a kickstarter campaign about their PCBite 2.0, a hands free assistance for your electronic measurements. The campaign has 17 days to go, with pledges starting from 30 USD.

 Last year we created the flexible and rock solid PCB holder – the end to wobbly circuit boards on your workbench. TODAY we proudly present the perfection of a measurement tool.  A steady but yet flexible precision probe made for instant measurements or total hands-free operations. PCBite precision probe has a flexible metal arm and a powerful magnet in the base .The measuring tip comes with a thread interface for several mounting options.

PCBite 2.0 – Hands-free & steady solution for your measurements – [Link]

RadarBox24.com – Live Flight Tracker and Flight Status

AirNav Systems develops flight tracking software able to live track flights from around the globe. The solutions are developed by real aviation professionals (airline pilots, engineers and air traffic controllers) -and RadarBox24 was developed on a real world aviation environment. ADS-B receivers used are AirNav RadarBox Pro and AirNav RadarBox 3D. Every RadarBox receiver is designed to share real-time flight data to AirNav Systems servers. Data comes from thousands receivers from all over the world and is processed (at an amazing rate of over 20 million messages per day). Finally data is provided in web browsers and mobile solutions.

Now you can build your own Raspberry Pi data feeder using RBFeeder client and sent data to Radarbox24. This short article will explain everything you need to know about our new Linux based client and how you can install it on your Raspberry Pi.

Raspberry Pi Internet Weather Station

The RPi Internet Weather Station project displays the weather information such as temperature, humidity and successive weather forecast.

The 4DPi-35-II is a 3.5″ 480×320 Primary Display for the Raspberry Pi, which plugs directly on top of a Raspberry Pi and displays the primary output which is normally sent to the HDMI or Composite output. It features an integrated Resistive Touch panel, enabling the 4DPi-35-II to function with the Raspberry Pi without the need for a mouse.

Raspberry Pi Internet Weather Station – [Link]

How to reduce Arduino Uno power usage by 95%

Patrick Fenner @ deferredprocrastination.co.uk shows us how to reduce the power consumption of Arduino UNO. He achieved that by modifying the following parts.

To reduce the overall power usage of the Arduino UNO board significantly:

  • replace the linear regulator with a DC-DC converter,
  • adjust the USB-to-Serial circuit so it’s only powered from the USB port,
  • cut out (or desolder) the always-on LED’s on the board,
  • use the processor sleep mode.

How to reduce Arduino Uno power usage by 95% – [Link]

Instrumentation Amplifier For Pressure Sensor

General purpose differential amplifier project has been designed for various pressure sensor amplifier applications. Circuit provided with multiple resistors, capacitors, dual sensor options and 4 pin Header connector to interface other external sensors. Schematic is an example from NXP application AN1318 Figure 2.

The most popular silicon pressure sensors are piezo-resistive bridges that produce a differential output.

Voltage output is in response to pressure applied to a thin silicon diaphragm. Output voltage for these sensors is generally 25 to 50 mV full scales. Interface to microcomputers, therefore, generally involves gaining up the relatively small output voltage, performing a differential to single ended conversion, and scaling the analog signal into a range appropriate for analog to digital conversion.

Instrumentation Amplifier For Pressure Sensor – [Link]

Instrumentation Amplifier For Pressure Sensor

General purpose differential amplifier project has been designed for various pressure sensor amplifier applications. Circuit provided with multiple resistors, capacitors, dual sensor options and 4 pin Header connector to interface other external sensors.  Schematic is an example from NXP application AN1318 Figure 2.

The most popular silicon pressure sensors are piezo-resistive bridges that produce a differential output.

Voltage output is in response to pressure applied to a thin silicon diaphragm. Output voltage for these sensors is generally 25 to 50 mV full scales. Interface to microcomputers, therefore, generally involves gaining up the relatively small output voltage, performing a differential to single ended conversion, and scaling the analog signal into a range appropriate for analog to digital conversion. The circuit published here is simple solution which amplify low voltage differential signal and provide single output voltage which can be directly feed to ADC of micro-controller. Instrumentation amplifiers are by far the most common interface circuits that are used with pressure sensors. An example of an inexpensive instrumentation amplifier based interface circuit uses an LM358 dual operational amplifier and several resistors that are configured as a classic instrumentation amplifier with one important exception. PR2 Trimmer potentiometer provided to set the offset voltage 0.75V. Setting the offset voltage to 0.75 V results in a 0.75 V to 4.75 V output that is directly compatible with microprocessor A/D inputs. Over a zero to 50° C temperature range, combined accuracy for an MPX2000 series sensor and this interface is on the order of ± 10%. Trimmer potentiometer PR1 helps to set the gain. PCB provided with MPXM2010GS and MPXV2010DP dual footprint options, for testing purpose MPXV2010DP sensors has been used.

The MPXV2010 series silicon Piezo-Resistive pressure sensors provide a very accurate and linear voltage output directly proportional to the applied pressure. These sensors house a single monolithic silicon die with the strain gauge and thin film resistor network integrated.  The sensor is laser trimmed for precise span, offset calibration and temperature compensation.

Note : Board is designed for multiple applications and has dual supply input option, Use 0E resistor instead of C8 or short the two terminals since circuit works on single supply.

Features

  • Supply 10V DC Single Supply
  • MPXV2010DP Pressure Range 0 to 10 kPa (0 to 1.45 psi)
  • Output 0.75V to 4.75V Approx. (Adjustable)
  • PR1 Trimmer Potentiometer Gain Adjust
  • PR2 Trimmer Potentiometer Offset Adjust

Schematic

Parts List

Instrumentation Amplifier Interface

Connections

Photos

Video

MPXV2010 Datasheet

8×8 pixel Time-of-Flight sensor is only 2.65×2.7mm

Swiss company Espros has completed its cwTOF imager family with the epc611, its smallest Time-of-Flight sensor to date, measuring only 2.65×2.7mm and delivering a 8×8 pixel field. by Julien Happich @ eenewseurope.com:

Sampling now and in volume production at TSMC, the chip can either be used as an 8×8 pixel imager for simple gesture recognition, door protection, or presence detection near machines, or as a fast range finder for simultaneous localization and mapping (SLAM) applications with rotating sensors.

8×8 pixel Time-of-Flight sensor is only 2.65×2.7mm – [Link]

Solar supercapacitor creates electricity and hydrogen fuel on the cheap

A replica of the UCLA device, which can produce both electricity and hydrogen

Researchers in University of California, Los Angeles (UCLA) made a device that may help bring hydrogen powered vehicles to the masses. This device uses sunlight to produce both hydrogen and electricity at the same time. The UCLA device is a hybrid unit that combines a supercapacitor with a hydrogen fuel cell, and runs on solar power. [via]

People need fuel to run their vehicles and electricity to run their devices,” says Richard Kaner, senior author of the study. “Now you can make both fuel and electricity with a single device.

Along with the usual positive and negative electrodes, the device has a third electrode that can either store energy electrically or use it to split water into its constituent hydrogen and oxygen atoms – a process called water electrolysis.

Google offers AI vision kit for Raspberry Pi owners

Google’s Vision Kit lets you build your own computer-vision system for $45 along with your own Raspberry Pi.

The company has now launched the AIY (AI yourself) Vision Kit that lets you turn Raspberry Pi equipment into an image-recognition device. The kit is powered by Google’s TensorFlow machine-learning models and will soon gain an accompanying Android app for controlling the device.

According to Google, Vision Kit features “on-device neural network acceleration”, allowing a Raspberry Pi-based box to do computer vision without processing in the cloud. The AIY Voice Kit relies on the cloud for natural-language processing.

Google offers AI vision kit for Raspberry Pi owners – [Link]

TOP PCB Companies