Peter Demchenko discuss about a design idea on how to test capacitors in circuit.
The electrolytic capacitor is far from being the most reliable electronic component. One of its failure modes – a gradual loss of capacity – can hardly be noticed until power supply malfunction occurs. Thus, any chance to monitor the condition of the filter capacitors of an electronic device in situ would be a useful thing.
Intersil’s ISL9238 and ISL9238A add 5V-20V reverse boost for USB On-The-Go charging of portables such as smartphones and headphones; two USB-C buck-boost battery chargers support bidirectional power delivery in ultrabooks, tablets, power banks and other mobile products. by Graham Prophet @ edn-europe.com:
The single-chip ISL9238 and ISL9238A battery chargers can replace two-chip solutions to reduce bill of materials (BOM) costs by up to 40%. Both ICs employ Intersil’s R3 modulation technology to extend battery life and deliver acoustic noise-free operation, improved light-load efficiency and fast transient response. The ISL9238 and ISL9238A operate in forward buck, boost or buck-boost mode to fast charge mobile battery packs with up to 4-cell Li-ion batteries.
The ESP8266 WiFi Module is a self-contained SOC that can give any microcontroller access to your WiFi network. It’s an extremely cost-effective board with a huge and ever-growing community. Each ESP8266 module comes pre-programmed with an AT command set firmware. This module has a powerful on-board processing and storage capability that allows it to act as a standalone microcontroller.
Following 2 easy steps, you can upload Arduino sketches on your ESP8266 using Arduino IDE.
Configuring the IDE
Making the circuit
Parts List
ESP 8266 Module.
Jumper wires.
A breadboard.
One USB to TTL converter, a.k.a UART converter.
Configuring The IDE
In order to bring support for ESP8266 chips to the Arduino environment, you need to add ESP8266 Arduino Core in the IDE.
You must have Arduino IDE version 1.6.4 or higher. The latest version is highly recommended. Download the latest version of IDE from Arduino.cc
Install Arduino 1.6.8.
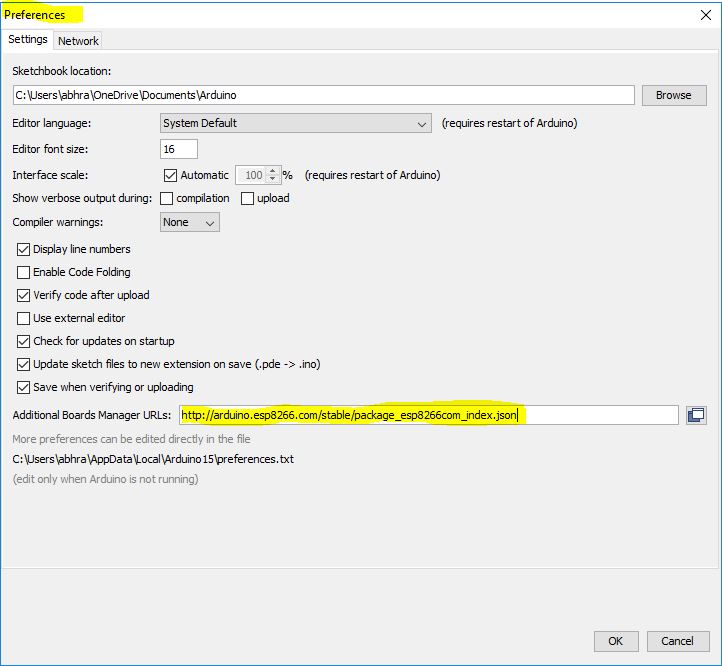
Start Arduino and open Preferences window.
Enter http://arduino.esp8266.com/stable/package_esp8266com_index.json into Additional BoardManager URLs field. (See the first image)
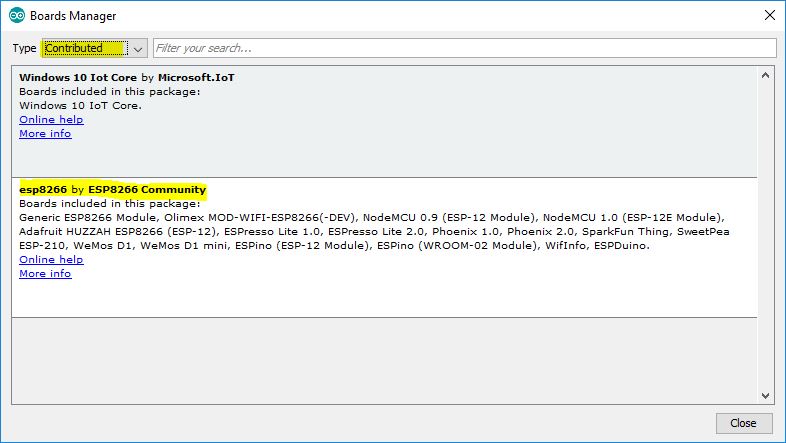
Open Boards Manager from Tools > Board menu and install ESP8266 platform. (See the second image)
Add URL to “Preferences” in Arduino IDE (as shown in cover screenshoot)
Select ESP8266 board from Board Manager (as shown above)
Making The Circuit
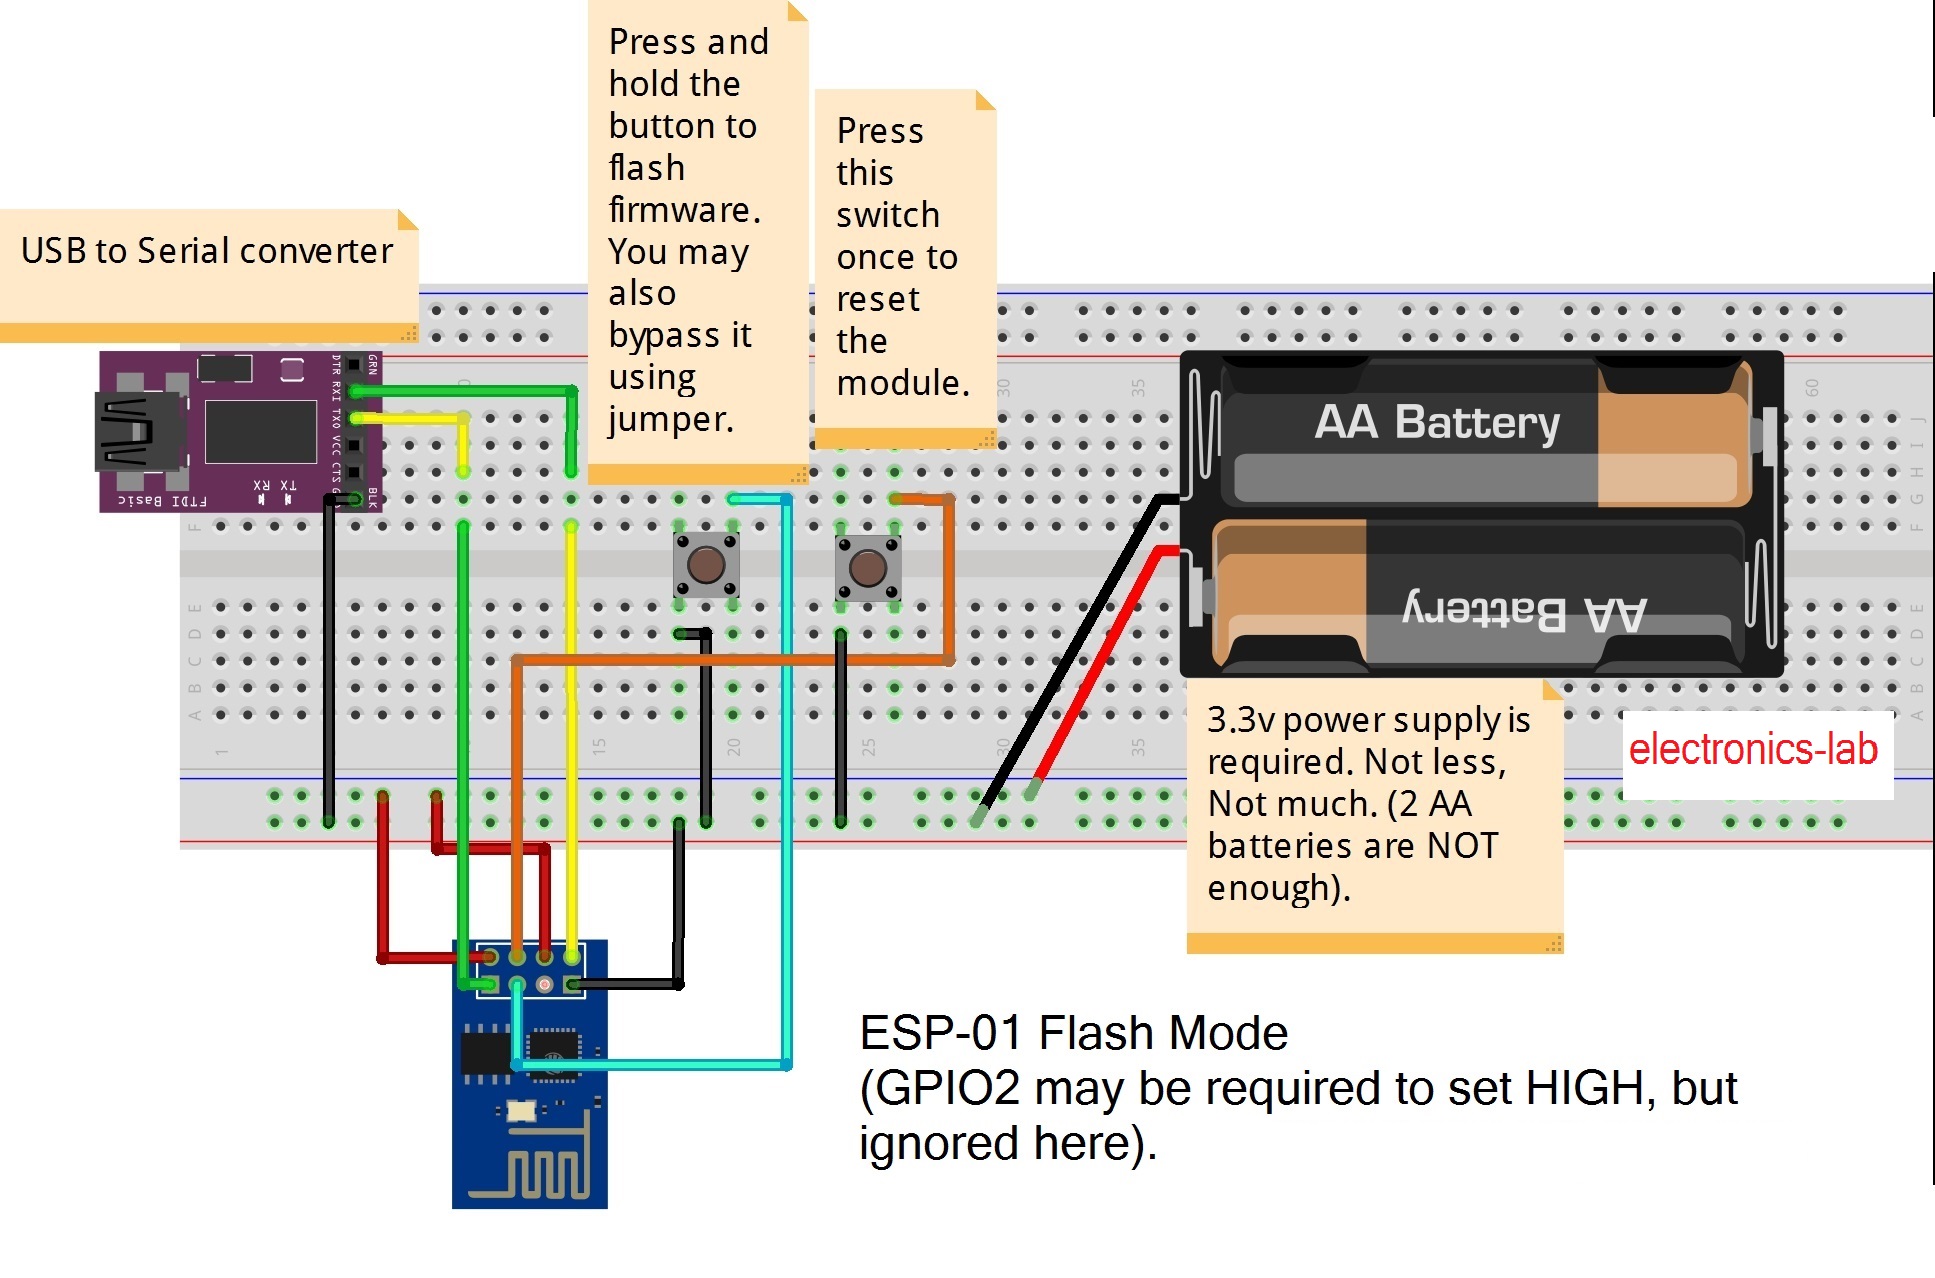
ESP8266-01 wiring for uploading program
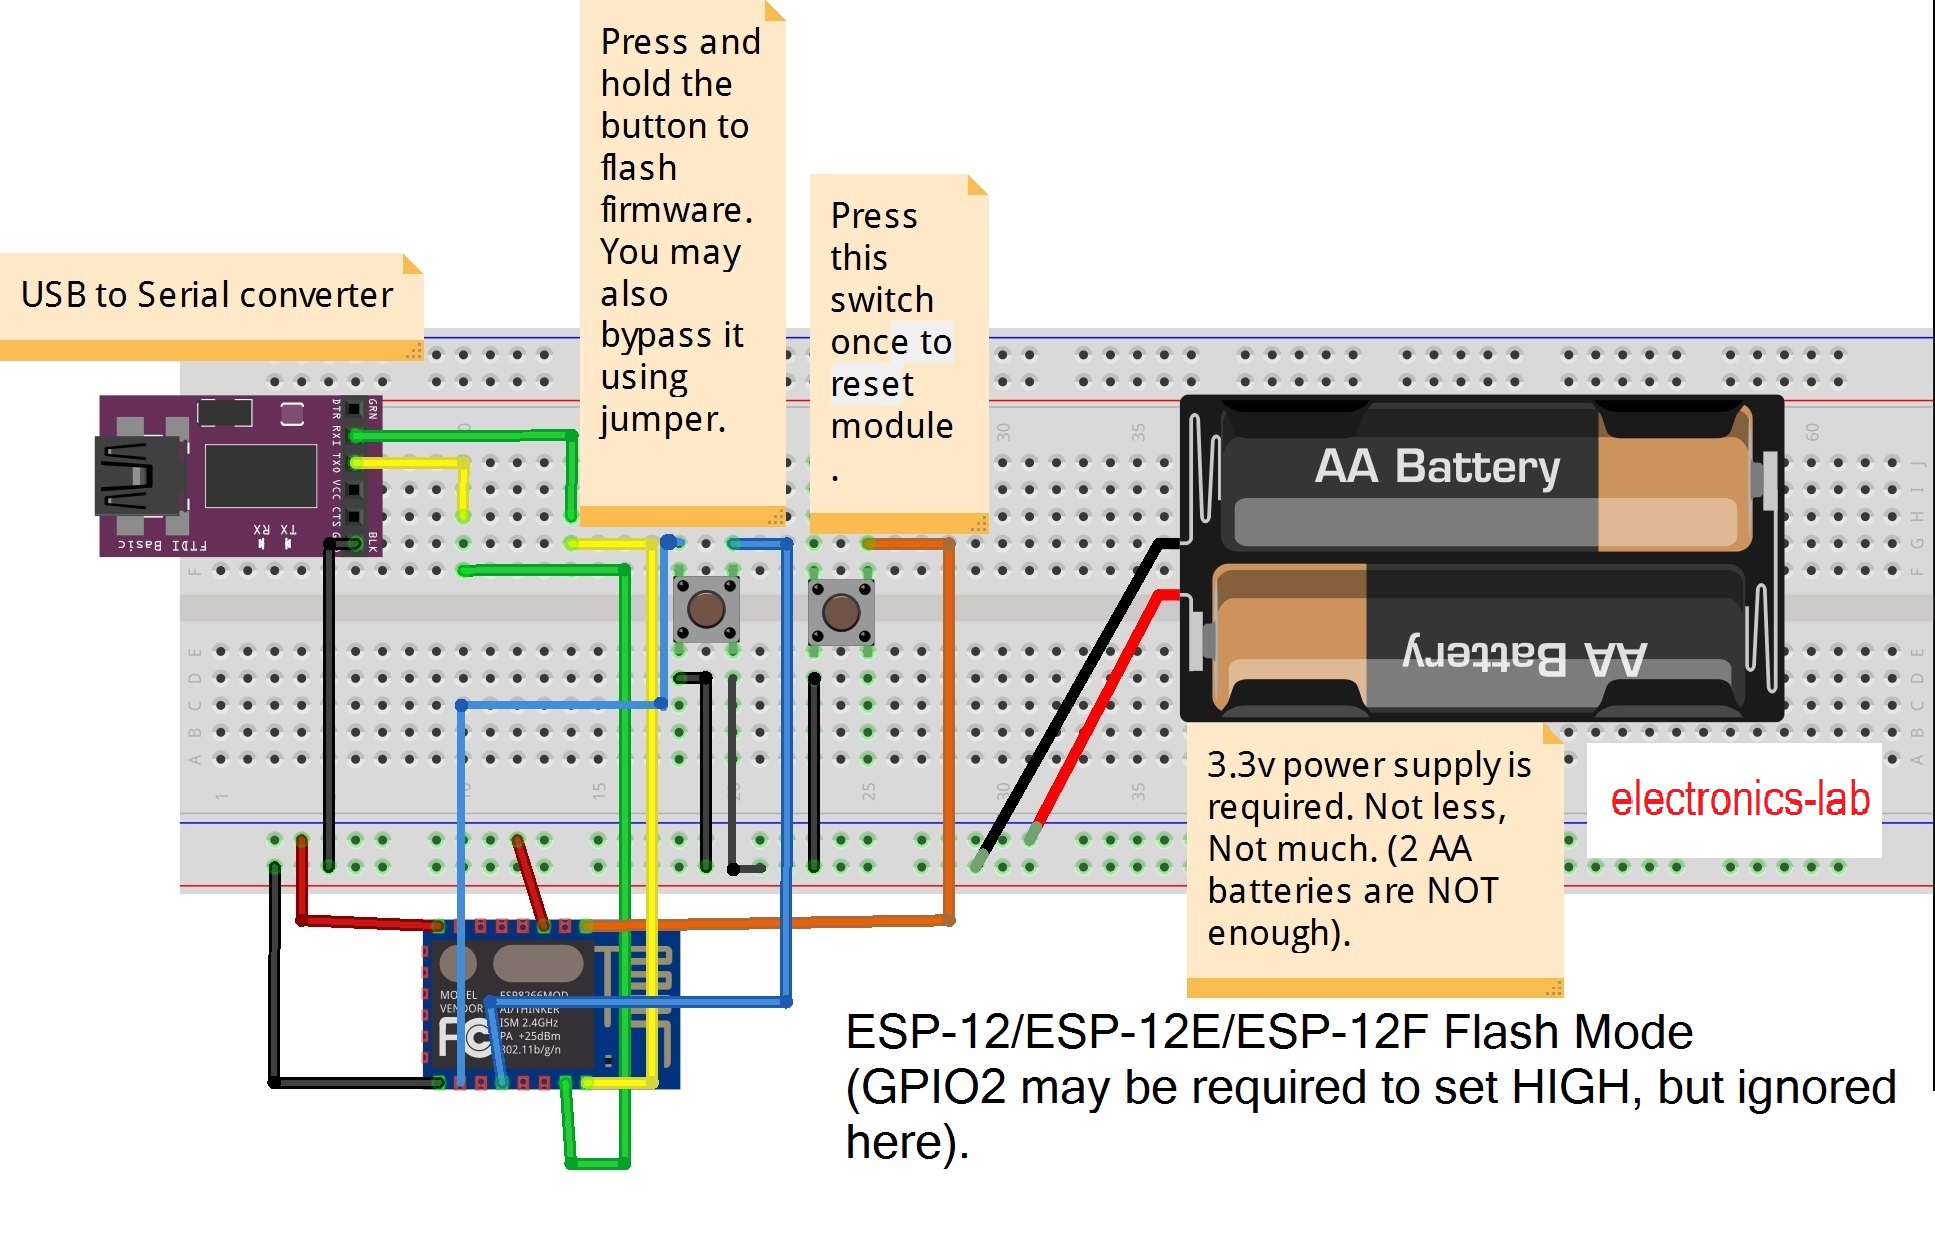
ESP8266-12E wiring for uploading program
ESP-01:
Connect GPIO0 to Ground (set it LOW or 0)
Connect CH_PD toVcc (set it HIGH or 1)
ESP-12(E/F):
Connect GPIO0 to Ground (set it LOW or 0)
Connect GPIO15 to Ground (set it LOW OR 0)
Connect GPIO2 to Vcc (set it HIGH or 1)
Connect CH_PD toVcc (set it HIGH or 1)
Pin Vcc and GND should be connected to power supply’s +VE and -VE rail respectively. TX and RX of ESP8266 should be connected to RX and TX of USB to TTL converter respectively.
You can replace the USB to TTL converter with an Arduino UNO board, but you have to upload a blank sketch or “bare-minimum” sketch to the Arduino so that the MCU of the Arduino board doesn’t interrupt. Connect TX and RX of the ESP8266 to RX and TX of the Arduino UNO respectively.
Conclusion
You are done! Now just select your ESP8266 board from Tools > Board menu, write any program, and click on Upload button. The ESP8266 will run as standalone microcontroller now.
Alan X has been working on a spectrum analyser project that can show the spectrum visually! He started working with ATTiny85 and kept on updating the project over time.
Alan X used Goertzel’s algorithm with a Hamming window, this algorithm can be used to detect a frequency from sampled data. Here is the preliminary code for a spectrum analyzer:
#include <stdio.h>#include <stdlib.h>#include <math.h>// Uses Daniil Guitelson's BGI library#include "graphics.h" // -lBGI -lgdi32#define SampleFreq 125000intmain(void)
{
int N=250;
double data[N];
double samples[N];
double freq;
double s;
double s_prev;
double s_prev2;
double coeff;
double magn;
int i;
int gd=CUSTOM, gm=CUSTOM_MODE(700,700);
initgraph(&gd, &gm, "");
setcolor(WHITE);
int X1,Y1,X2,Y2;
double scale,xmin,ymin,xmax,ymax;
// Find the maximum and minimum data range
xmin=0;
ymin=0;
xmax=50000;
ymax=N;
scale=1.1*(xmax-xmin>ymax-ymin?xmax-xmin:ymax-ymin);
// Generate samplesfor (i=0;i<N;i++) {
samples[i]=(50*sin(2*M_PI*i*3300/SampleFreq)+50*sin(2*M_PI*i*5700/SampleFreq)+50*sin(2*M_PI*i*25700/SampleFreq)+100);
// Window the data// data[i]=samples[i]; // Straight Goertzel - not great// data[i]=samples[i]*(0.5-0.25*cos(2*M_PI*i/N)); // Hanning Window
data[i]=samples[i]*(0.54-0.46*cos(2*M_PI*i/N)); // Hamming Window// data[i]=samples[i]*(0.426551-0.496561*cos(2*M_PI*i/N)+0.076848*cos(4*M_PI*i/N)); // Exact Blackman Window
}
// Scan frequenciesfor (freq=100;freq<=50000;freq+=100) {
coeff=2*cos(2*M_PI*freq/SampleFreq);
s_prev=0.0;
s_prev2=0.0;
for (i=0;i<N;i++) {
// Goertzel
s=data[i]+coeff*s_prev-s_prev2;
s_prev2=s_prev;
s_prev=s;
}
// Get magnitude
magn=2*sqrt(s_prev2*s_prev2+s_prev*s_prev-coeff*s_prev*s_prev2)/N;
printf("Freq: %6f Mag: %6.4f\n",freq,magn);
// Plot data
X1=(int)((freq-(xmin+xmax)/2)*700/scale+350);
Y1=(int)((0+(ymin+ymax)/2)*700/scale+650);
X2=(int)((freq-(xmin+xmax)/2)*700/scale+350);
Y2=(int)((-magn*700/2+(ymin+ymax)/2)*700/scale+650);
line(X1,Y1,X2,Y2);
}
getchar();
closegraph();
return0;
}
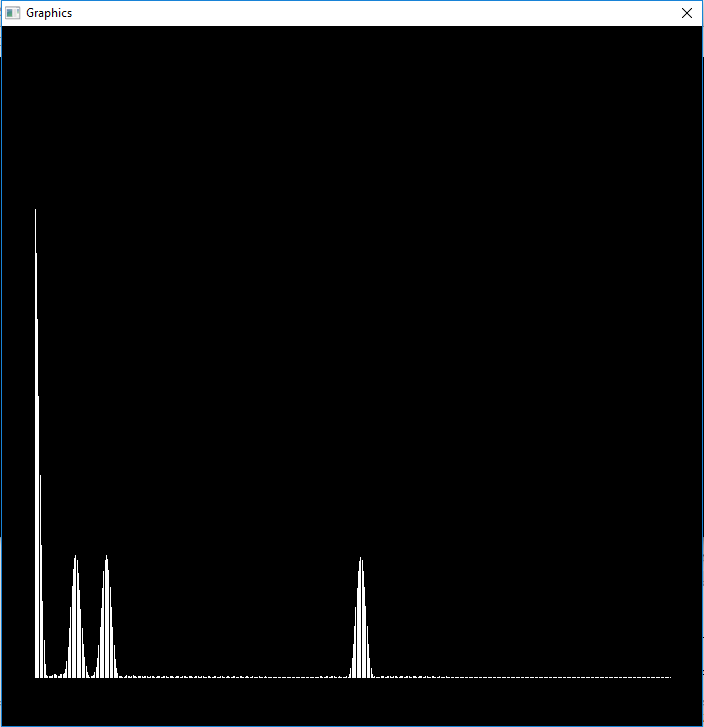
Here is the output showing the DC, 3300 Hz, 5700 Hz and 25700 Hz signals:
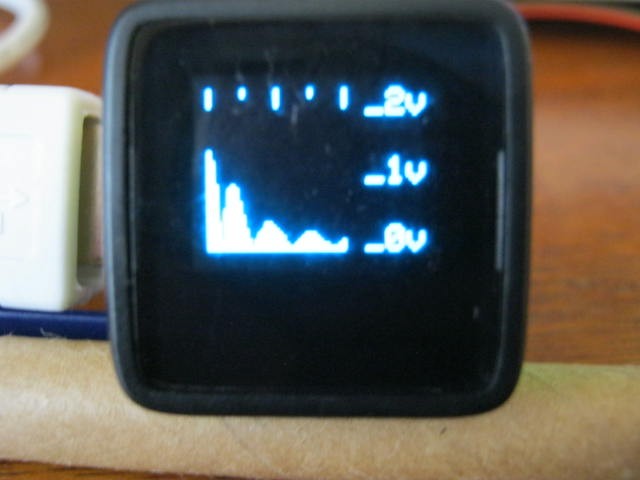
The next step is to port the code to a suitable Arduino board and to show the results physically. Thus, he used a MicroView OLED display and here it is listening to a 3v 1kHz square wave:
#include <MicroView.h>// Audio Spectrum Analyser#define SampleInput A0 // Name the sample input pin#define BandWidth 500 // BandWidth#define MaxFreq 4000 // Max analysis frequency#define Trigger 10 // Trigger to synchronise the sampler 2vpp at 1kHz = 32// Define various ADC prescalerconstunsignedchar PS_16=(1<<ADPS2);
constunsignedchar PS_32=(1<<ADPS2)|(1<<ADPS0);
constunsignedchar PS_64=(1<<ADPS2)|(1<<ADPS1);
constunsignedchar PS_128=(1<<ADPS2)|(1<<ADPS1)|(1<<ADPS0);
// Setup the serial port and pin 2voidsetup() {
// Setup the ADC
pinMode(SampleInput,INPUT);
ADCSRA&=~PS_128; // Remove bits set by Arduino library// Set prescaler// ADCSRA|=PS_64; // 64 prescaler (250 kHz assuming a 16MHz clock)// ADCSRA|=PS_32; // 32 prescaler (500 kHz assuming a 16MHz clock)
ADCSRA|=PS_16; // 16 prescaler (1 MHz assuming a 16MHz clock)
uView.begin();// Start MicroView
uView.clear(PAGE); // Clear page
uView.println("Spectrum Analyser"); // Project
uView.println("0-20 kHz"); // Range
uView.println();
uView.println("agp.cooper@gmail.com"); // Author
uView.display(); // Display
uView.clear(PAGE); // Clear page
delay(2000);// Wait
}
voidloop() {
static byte *samples; // Sample array pointerstatic byte *window; // Window array pointerstaticint N=0; // Number of samples for BandWidthstaticlong sampleFreq; // Sample frequencylong freq; // Frequency of interestfloat s; // Goertzel variablesfloat s_prev;
float s_prev2;
float coeff;
float magn;
int i;
if (N==0) {
// Check sample frequency and set number of samples
samples=(byte *)malloc(100);
unsignedlong ts=micros();
for (i=0;i<100;i++) samples[i]=(byte)(analogRead(SampleInput)>>2);
unsignedlong tf=micros();
free(samples);
sampleFreq=100000000/(tf-ts);
N=2*sampleFreq/BandWidth+1;
uView.setCursor(0,0); // Set cursor to beginning
uView.print("SI: A"); // Sample input pin
uView.println(SampleInput-14);
uView.print("SF: "); // Sample frequency
uView.println(sampleFreq);
uView.print("MF: "); // Max frequency
uView.println(MaxFreq);
uView.print("BW: ");// andWidth
uView.println(MaxFreq);
uView.print("SN: ");// Number of samples
uView.println(N);
uView.display(); // Display
uView.clear(PAGE);// Clear page
delay(2000);
// Create arrays
samples=(byte *)malloc(N);
window=(byte *)malloc(N);
// Modified Hamming Windowfor (i=0;i<N;i++) window[i]=(byte)((0.54-0.46*cos(2*M_PI*i/(N-1)))*255);
// Generate test samplesfor (i=0;i<N;i++) {
samples[i]=(byte)(30*(sin(2*M_PI*i*5000/sampleFreq)+sin(2*M_PI*i*2500/sampleFreq)+sin(2*M_PI*i*7500/sampleFreq)+sin(2*M_PI*i*10000/sampleFreq))+127);
}
}
if (true) {
// Sychronise the start of sampling with data slicerint a0,a1;
a0=1023;
for (i=0;i<N;i+=2) {
a1=analogRead(SampleInput);
a0=(a0*13+a1*3)/16;
if (a1>a0+3) break;
}
for (i=0;i<N;i++) samples[i]=(byte)(analogRead(SampleInput)>>2);
}
// Scan frequenciesfor (freq=0;freq<=MaxFreq;freq+=(MaxFreq/40)) {
// Goertzel (https://en.wikipedia.org/wiki/Goertzel_algorithm)
coeff=2*cos(2*M_PI*freq/sampleFreq);
s_prev=0;
s_prev2=0;
for (i=0;i<N;i++) {
s=0.0000768935*window[i]*samples[i]+s_prev*coeff-s_prev2;
s_prev2=s_prev;
s_prev=s;
}
// Get magnitude
magn=2*sqrt(s_prev2*s_prev2+s_prev*s_prev-coeff*s_prev*s_prev2)/N;
// Display on MicroView
uView.line(freq*40/MaxFreq,47,freq*40/MaxFreq,10-(int)(20*log10(magn+0.0001)));
}
// Frequency graduations
uView.setCursor(47,0);
uView.print(MaxFreq/1000);
uView.print("k");
uView.line(0,0,0,5);
uView.line(10,0,10,2);
uView.line(20,0,20,5);
uView.line(30,0,30,2);
uView.line(40,0,40,5);
// Voltage graduations
uView.line(0,40,40,40);
uView.setCursor(47,38);
uView.print("-30");
uView.line(0,20,40,20);
uView.setCursor(47,18);
uView.print("-10");
uView.line(0,10,40,10);
uView.setCursor(47,8);
uView.print(" 0");
//Display
uView.display();
uView.clear(PAGE);
}
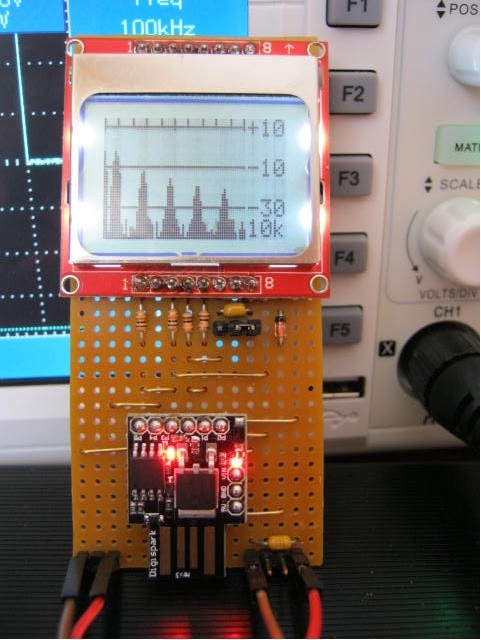
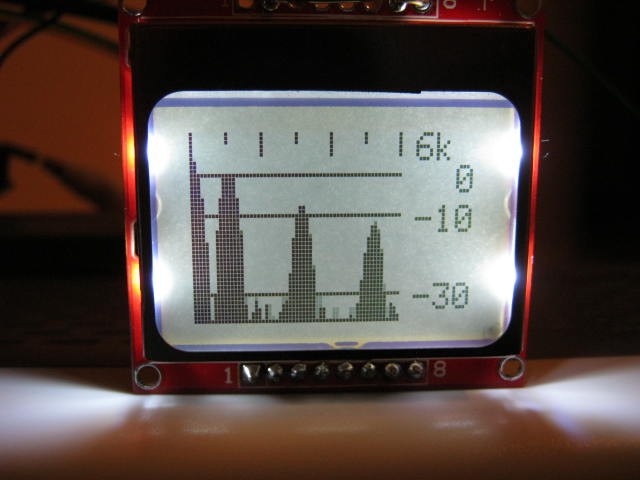
He then updated the project to work with Nokia LCD, here it is showing the 0-3v 1 kHz square wave signal:
Amazing ideas and projects can be inspired by this project. You can download these files to start your own spectrum analyser!
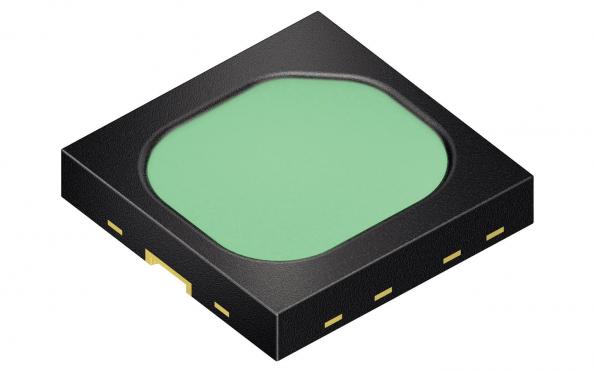
Designed for everyday food analytics, the SFH 4735 LED emits broadband infrared light in a wavelength range from 650 to 1,050 nanometers. by Julien Happich @ edn-europe.com
The component is well suited as a light source for near-infrared spectroscopy, for example to assess the quality of food thanks to mini spectrometers that could be developed as an add-on for smartphones.
World’s first broadband infrared LED by Osram – [Link]
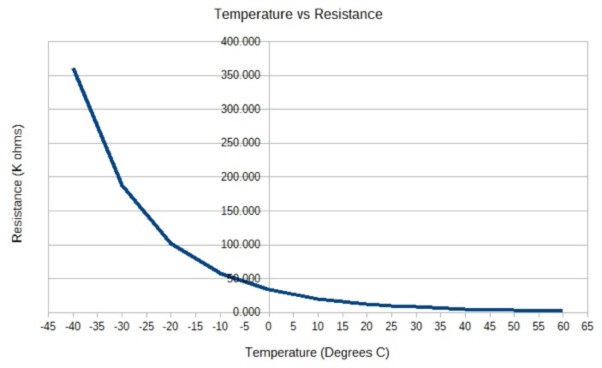
Philip Kane @ jameco.com discuss about how to measure temperature with NTC thermistors. He writes:
Thermistors (thermal resistors) are temperature dependent variable resistors. There are two types of thermistors, Positive Temperature Coefficient (PTC) and Negative Temperature Coefficient (NTC). When the temperature increases, PTC thermistor resistance will increase and NTC thermistor resistance will decrease. They exhibit the opposite response when the temperature decreases.
Temperature Measurement with NTC Thermistors – [Link]
Internet of LEGO “IoL” is an interactive LEGO city built and designed by Cory Guynn, a cloud computing and IoT enthusiast. This project combines computer and electronics engineering with our favorite childhood toy, LEGO!
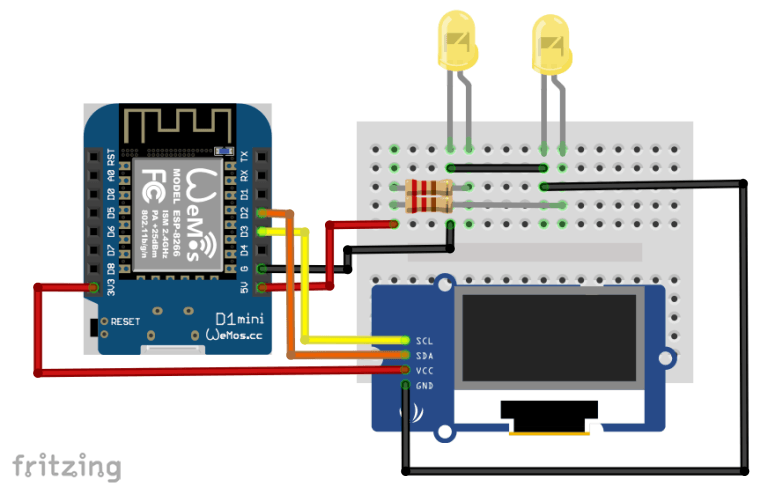
A recently added project is a digital billboard that broadcasts the weather information from IoL local weather station. It uses a Raspberry Pi running Node-RED to collect weather data from the local station and display it on an OLED screen powered by an ESP8266.
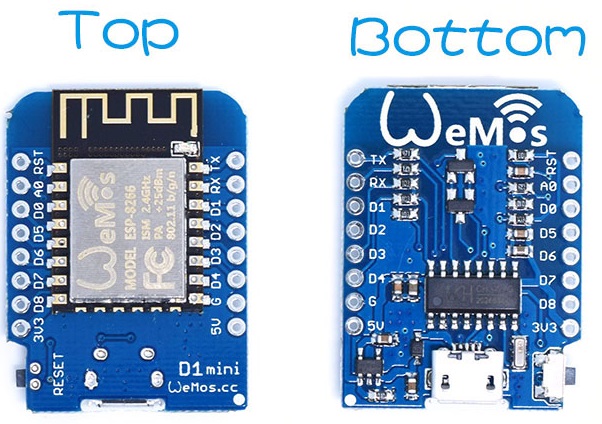
WeMos D1 mini is a cheap mini wifi board based on ESP8266 and compatible with Arduino and NodeMCU. It has 11 digital I/O pins that support PWM, I2C, and interrupts, and has only one analog input with a microUSB connector. The WeMos D1 is available for only $4 and is supported by many shields.
WeMos D1 mini top and bottom faces
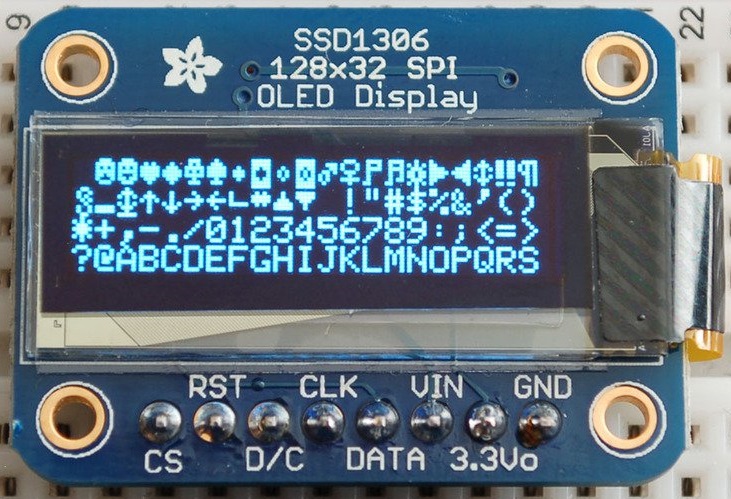
The 128X64 OLED is about 1.3″ display, it is very readable due to its high contrast. This display is made of 128×64 individual white OLED pixels, each one is turned on or off by the controller chip. No backlight is required because the display makes its own light, which reduces the power required to run the OLED.
OLED’s driver chip, SSD1306 can communicate in two ways: I2C or SPI. The OLED itself require a 3.3V power supply and 3.3V logic levels for communication.
The display uses I2C connection at this project, so you will need to solder the two jumpers (SJ1/2) on the back of the OLED, then use the ‘Data’ pin as ‘I2C SDA’ pin and ‘CLK’ pin as ‘I2C SCL’. The WeMos D1, OLED, LEDs, and resistors are connected as shown in the figure.
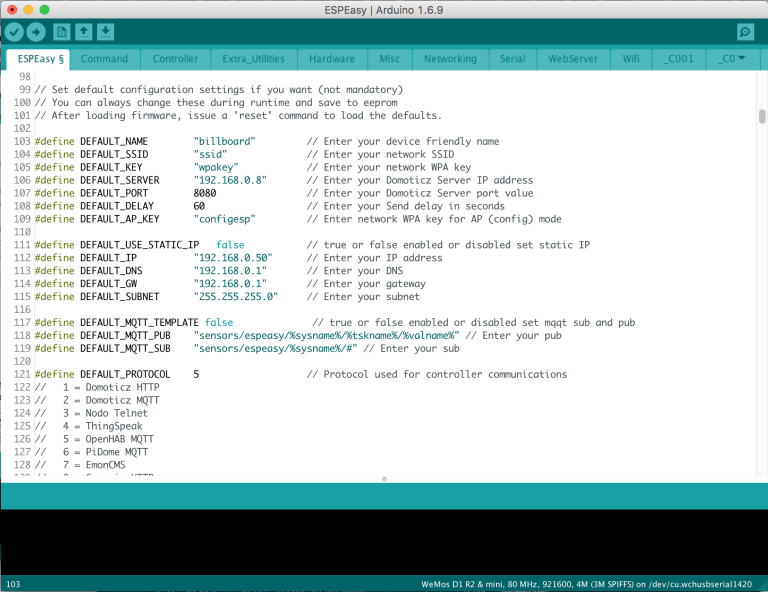
To simplify configuring WeMos D1, a special firmware called “ESPEasy” has been used. It is a free and open-source web configurable software framework for IoT, which allows the device to be configured using the web browser instead of writing codes.
ESPEasy can be uploaded to the WeMos D1 using the Arduino IDE by installing the ESP8266 board support from Boards Manager, and then uploading the ESPEasy firmware as described in this tutorial.
ESPEasy Firmware on Arduino IDE
MQTT is a lightweight machine-to-machine publish/subscription messaging protocol. It works like Twitter where each device will subscribe and/or publish to a topic, much like a #hashtag, and the payload will then contain the data being transmitted.
Mosquitto is a free open source broker that works perfectly on a Raspberry Pi. It is a MQTT server manages the MQTT message flow, and connects with all devices.
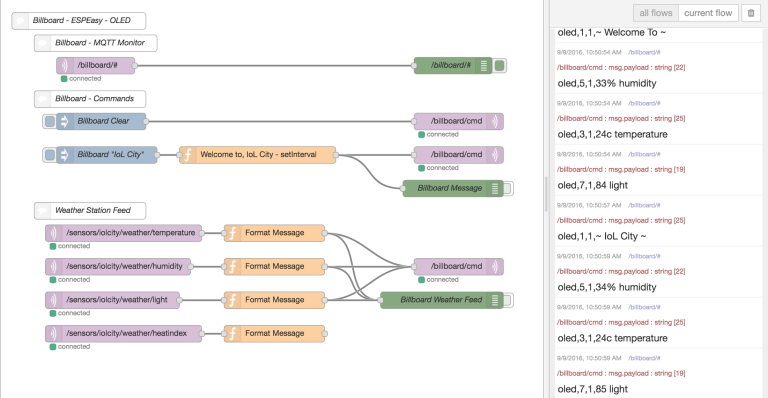
The last step is configuring the Raspberry Pi on the weather station for sending the information to the billboard. An easy way for that is using Node-Red, a visual tool for wiring together hardware devices, APIs and online services for IoT applications.
Node-Red is pre-installed on the Raspbian Jessie image. Run the software and download this flow. It will accept an MQTT message on the topic “/sensors/iolcity/weather/#” and transmit it to the WeMos on the topic “/billboard/cmd”. Function nodes will format the message using JavaScript.
Node-RED Billboard MQTT Flow
You can use it with your own weather station or any other sources of data, just change the MQTT input nodes to match your topics. To build a weather station check this IoL project and this ChipKIT-based station. Alternatively, you could get weather data using the Weather Underground service with the Node-RED node.
Further information and detailed description are available at the original project page.
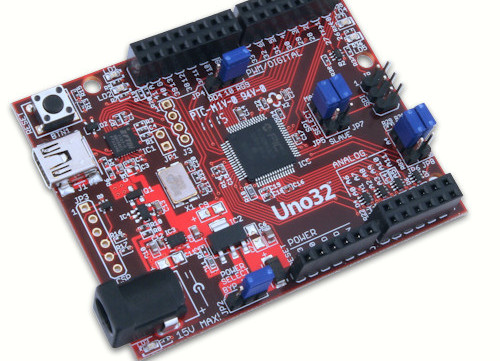
ChipKIT Uno32 by Digilent is an easy-to-use platform for developing microcontroller-based applications. It uses chipKIT-core development environment and Arduino IDE for compatibility with existing code examples, tutorials and resources. Pin-compatible with many Arduino shields that can operate at 3.3V.
It contains:
PIC32MX320F128H processor
128K Flash, 16K RAM
Up to 80 MHz operating speed
42 available I/O lines
USB or externally powered
USB cable required for programming (not included)
This kit is now discontinued and replaced by chipKIT uC32.
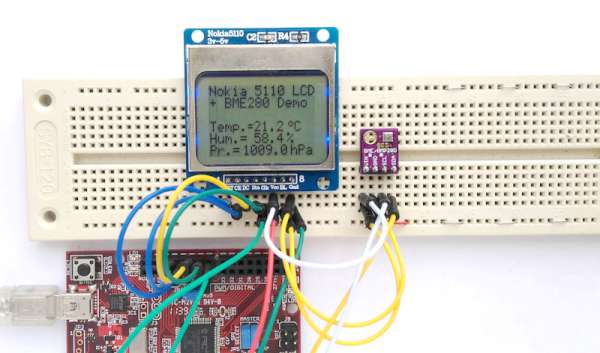
By following this tutorial you will be able to build a weather station based on chipKIT and using Bosch BME280 module, a fully integrated environmental unit that combines sensors for pressure, humidity, and temperature in a tiny 8-pin metal-lid LGA package of size 2.5 x 2.5 x 0.93 mm³. This module seems popular due to many features such as its support for standard I2C and SPI interfaces and availability of supporting open-source Arduino libraries.
R-B, the maker behind this project, uses BME280 to read barometric pressure, relative humidity, and temperature measurements then the readings will be sent via I2C bus and finally displayed on a Nokia 5110 LCD.
Hardware Setup:
You will need these parts in order to build this project:
ChipKIT Uno32
BME 280
Nokia 5110 LCD: It is a 48×84 pixels matrix LCD driven by the low-power PCD8544 controller chip. It is powered by 3.3V and includes on-chip generation of LCD supply and bias voltages, thus requiring minimum external components for its operation. The PCD8544 receives display data and commands from a microcontroller through a serial bus interface.
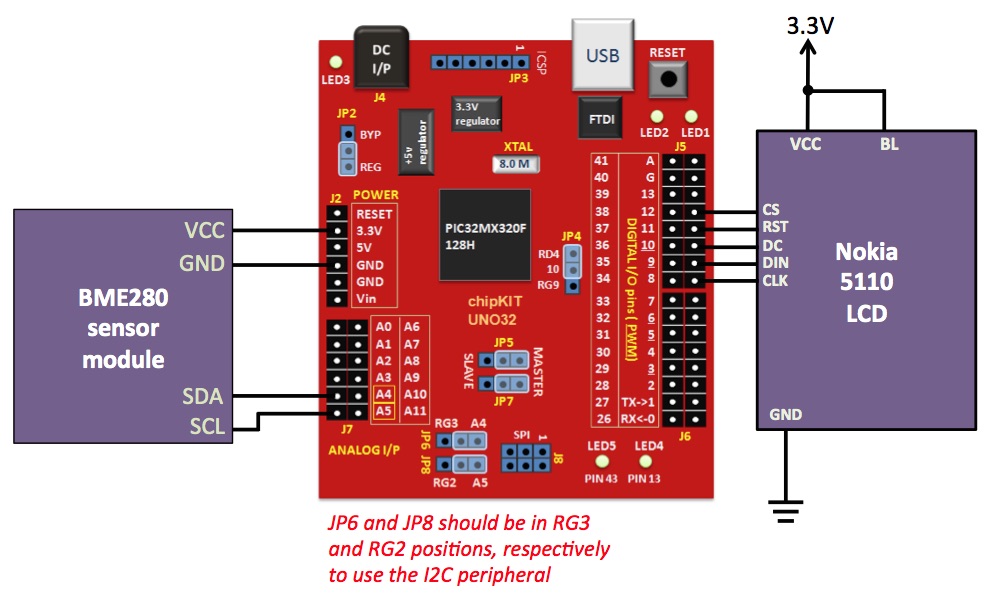
The complete hardware setup for this project is shown in the following figure:
Connections between chipKIT Uno32, BME280 and Nokia 5110 LCD
Software
You will need to install the following libraries prior to develop the firmware for this project.
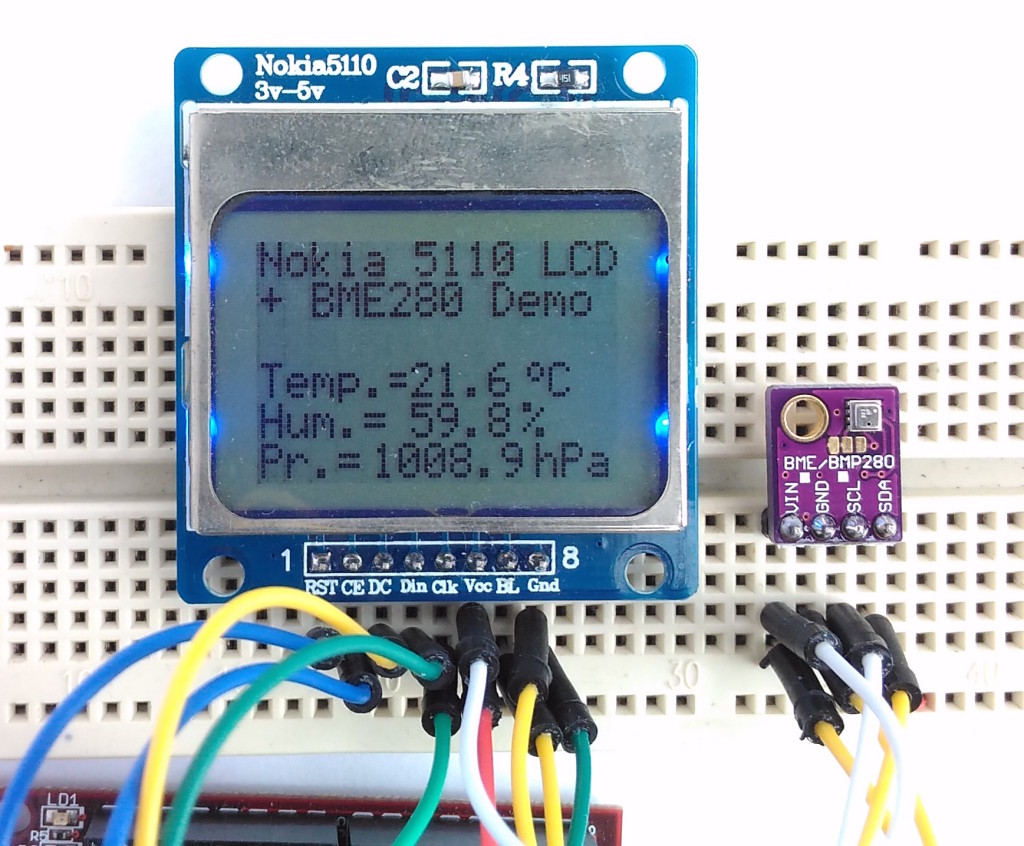
The program displays ambient temperature in Centigrade, humidity in %, and atmospheric pressure in hectopascal (hPa) units.
Weather station displaying temperature, humidity, and pressure shown in hPa unit.
Full description of how to connect the modules together, how to set the I2C connection and more detailed information are available at the project page.
Just download the complete program, get the needed parts and you are ready to build your own weather station! You can check other tutorials by R-B here.
LTC3119 is a synchronous current mode monolithic buck-boost converter that outputs up to 5A of continuous output current in buck mode from a wide variety of input sources, including single- or multiple-cell batteries, unregulated wall adapters as well as solar panels and supercapacitors. By Graham Prophet @ edn-europe.com:
The device’s 2.5V to 18V input voltage range extends down to 250 mV once started. The output voltage is regulated with inputs above, below or equal to the output and is programmable from 0.8V to 18V. User-selectable Burst Mode operation lowers quiescent current to 35 µA, improving light load efficiency and extending battery run time.


![From Sand to Circuits – How Intel makes integrated circuits [PDF]](https://www.electronics-lab.com/wp-content/uploads/2016/11/intel-604x270.jpg)