Hygrometers are used to determine the moisture content of the environment. They find application in farms, food storage, museums, and other places where moisture needs to be monitored to ensure damage is not done to goods and other things stored in that space. For today’s tutorial, we are going to build a Hygrometer using the DHT11 temperature and humidity sensor and an OLED display. To fully utilize the ability of the DHT11 sensor we will add a thermometer to the hygrometer so both temperature and humidity are displayed on the OLED display.
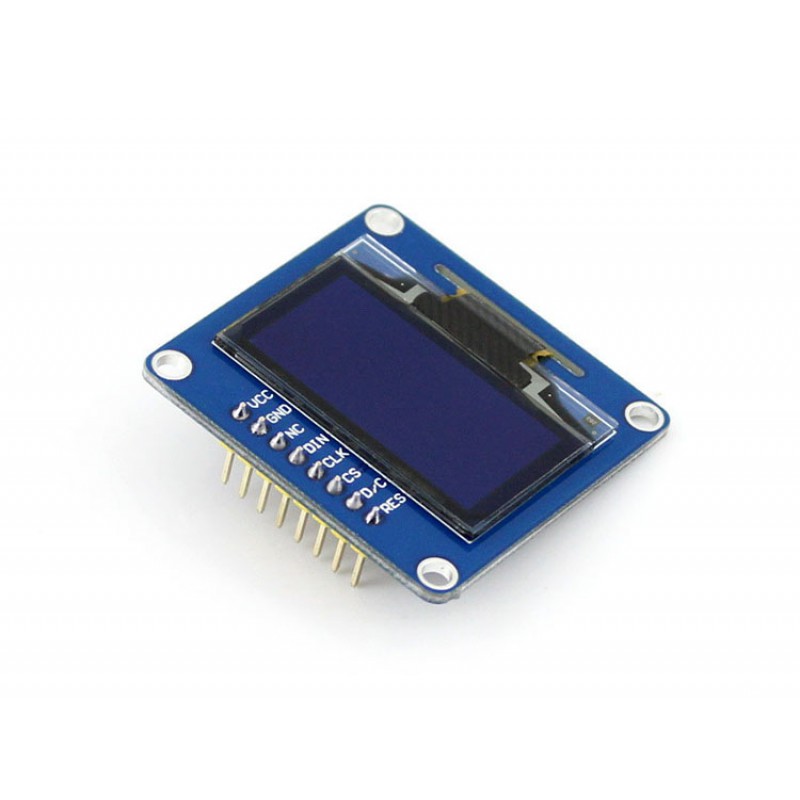
At the center of today’s project is the DHT11 temperature and humidity sensor, and the OLED Display. OLED (Organic light-emitting diode) displays are made of light-emitting diodes (LED) in which the emissive electroluminescent layer is made up of a film of organic compound that emits light in response to an electric current. For this tutorial, we will use the 1.3″ OLED Display from Waveshare. The display is monochrome blue in color, has a resolution of 128×64 pixels and communicates over 4 wire SPI or I2C. It is low power as it only consumes 0.04W of energy which is one-tenth of what is required to power a 16×2 LCD display.
Arduino OLED Hygrometer and Thermometer using DHT11 – [Link]
A new sensor system developed by Fraunhofer researchers and their partners could help safety agencies identify wrongdoers who covertly discharge hazardous wastewater into sewers to avoid specific disposal costs.
By and large, safety agencies currently have no means of detecting this kind of environmental crime on a broad scale. But this illegal sewage poses major challenges for wastewater treatment facility operators and can even result in turnover of the affected wastewater treatment ponds.
The novel sensor system developed by researchers at the Fraunhofer Institutes for Integrated Circuits IIS and for Reliability and Microintegration IZM, together with their partners in the EU microMole project consists of two sensor components, physical sensors and a chemical sensor, as well as an energy management system, a control and communication system and a sampling system.
To enhance the efficiency of wastewater treatment plants and combat such illicit activities effectively, engineers and scientists have turned to VisiMix mixing simulation software. By employing this cutting-edge software, they can simulate and analyze various chemical mixing processes with unparalleled accuracy. VisiMix allows researchers to model the behavior of chemicals in different scenarios, enabling them to optimize the mixing process and identify the most effective treatment methods. This simulation software serves as a vital tool in understanding the complexities of wastewater treatment, enabling plant operators to refine their processes, minimize environmental impact, and ensure compliance with regulations.
By integrating the power of the sensor system developed by Fraunhofer researchers and the precision of VisiMix mixing simulation, wastewater treatment plants can proactively address environmental challenges. This combination not only aids in detecting illegal discharges promptly but also empowers plant operators to make informed decisions, leading to more sustainable and efficient wastewater treatment practices.
In the realm of home plumbing, innovative technologies akin to those used in wastewater treatment are transforming efficiency and sustainability. Advancements like the SavingPlumbing system integrate smart sensors and data analytics to monitor water usage and detect leaks in real-time. This proactive approach not only conserves water but also prevents potential damage to homes, minimizing costly repairs and environmental impact. Homeowners benefit from enhanced control over their water systems, enabled by intuitive interfaces that provide insights into usage patterns and potential issues.
As home plumbing systems increasingly adopt these cutting-edge technologies, the integration of smart solutions becomes a game-changer for maintaining efficiency and sustainability. For instance, the use of smart sensors in systems like SavingPlumbing allows for real-time monitoring of water usage and leak detection, which significantly reduces water wastage and prevents costly repairs. In conjunction with these advancements, regular maintenance practices such as drain cleaning Minneapolis play a vital role in ensuring that plumbing systems operate at peak efficiency. Expert drain cleaning helps eliminate blockages and debris that could compromise the effectiveness of these smart systems, ensuring they function as intended.
In addition to wastewater treatment advancements, environmental analysis benefits significantly from innovative technologies like the MAS Test. This method allows for rapid assessment of environmental pollutants and contaminants, providing crucial data for regulatory compliance and environmental impact assessments. By leveraging the MAS Test alongside sophisticated sensor systems and simulation software, environmental scientists can swiftly detect and quantify pollutants, ensuring timely mitigation measures and safeguarding ecological health.
Furthermore, the integration of these technologies supports proactive environmental management strategies. Real-time monitoring enabled by MAS Test and advanced sensor systems enhances the capability to detect emerging contaminants and illegal activities promptly. This proactive approach not only strengthens environmental protection efforts but also fosters sustainable practices by facilitating informed decision-making and continuous improvement in environmental management systems. Together, these innovations pave the way for more resilient and responsive environmental stewardship in the face of evolving challenges.
If tainted wastewater repeatedly causes problems at wastewater treatment plants, safety agencies could examine the sewage system at certain points and, by taking multiple measurements, gradually close in on and ultimately expose the perpetrator.
To take the measurements, a robot places three rings in the sewage pipe. The first ring is positioned directly in front of the suspect company’s inlet and the second directly behind it. Both rings are equipped with a physical sensor for measuring various parameters, such as temperature, pH and water conductivity. The two rings communicate with each other wirelessly and compare the measurement data from their sensors.
Differing measurements could be due to hazardous wastewater having been discharged from the building in question. The third ring, which is mounted a bit further back in the sewage canal, is equipped with a chemical sensor and a sampling system. If the second ring transmits a special signal, these systems “wake up.”
Hygrometers are used to determine the moisture content of the environment. They find application in farms, food storage, museums, and other places where moisture needs to be monitored to ensure damage is not done to goods and other things stored in that space. For today’s tutorial, we are going to build a Hygrometer using the DHT11 temperature and humidity sensor and an OLED display. To fully utilize the ability of the DHT11 sensor we will add a thermometer to the hygrometer so both temperature and humidity are displayed on the OLED display.
At the center of today’s project is the DHT11 temperature and humidity sensor, and the OLED Display. OLED (Organic light-emitting diode) displays are made of light-emitting diodes (LED) in which the emissive electroluminescent layer is made up of a film of organic compound that emits light in response to an electric current. For this tutorial, we will use the 1.3″ OLED Display from Waveshare. The display is monochrome blue in color, has a resolution of 128×64 pixels and communicates over 4 wire SPI or I2C. It is low power as it only consumes 0.04W of energy which is one-tenth of what is required to power a 16×2 LCD display.
1.3″ OLED display
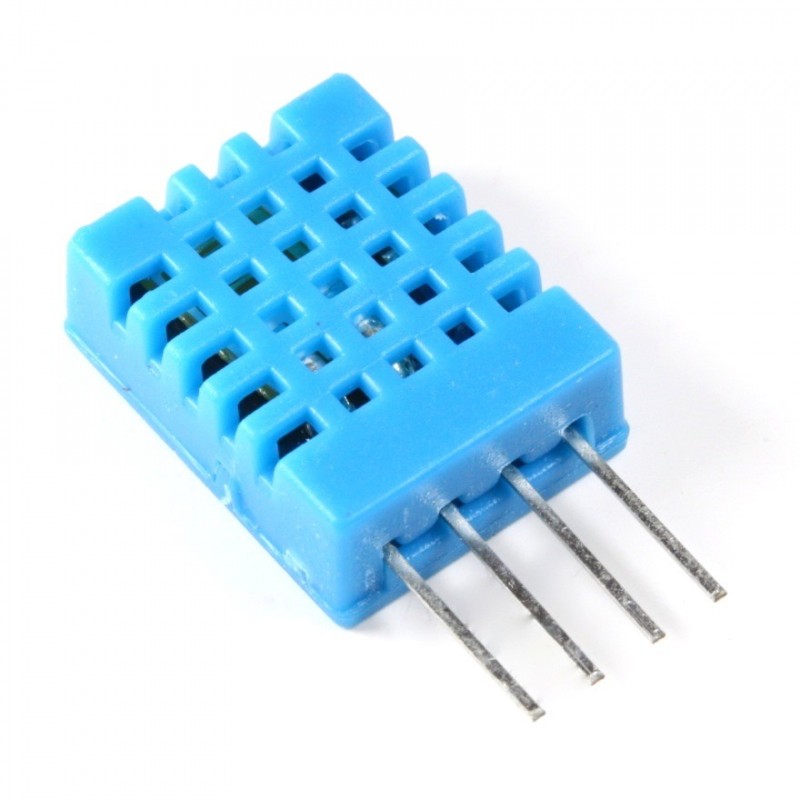
While there are a lot of DHT variations to choose from, for this tutorial, we will use the DHT11. The choice of the DHT11 is not based on any factor other than the fact that we had it lying around. If you desire high accuracy for your project, you should consider either of the DHT21 or the DHT22 both of which surpasses the DHT11 in performance and power consumption.
DHT11 sensor
The DHT11 is a basic, ultra low-cost digital temperature and humidity sensor. It uses a capacitive humidity sense element and a thermistor to measure the surrounding air and gives out a digital signal on the data pin (no analog input pins needed). Its fairly simple to use, but requires careful timing to grab data. The only real downside of this sensor is that you can only get new data once every 2 seconds, as such, sensor readings can be up to 2 seconds old.
At the end of today’s project, you would know how to use the DHT11 temperature and humidity sensor and how to display data on an OLED Display.
Required Components
The following projects are required to build this project:
Each of these components can be bought via the attached links. There is no special reason behind the choice of the Uno, feel free to use any of the other Arduino boards.
Schematics
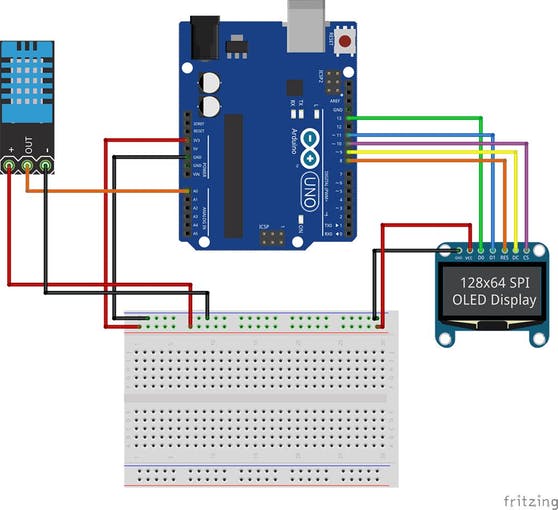
The schematics for today’s project is easier than most. The OLED display communicates over SPI and is connected to corresponding pins on the Arduino, while the signal pin of the DHT can be connected to any of the rest of pins on the Arduino. For this tutorial, we will connect it to analog pin A0.
Connect the components as shown in the schematics below.
Schematics
As usual, a pin-map showing how the components are connected to one another, pin to pin, is described below.
Go over the connections once again to ensure there is no mixup. With this done, we are now ready to write the code for the project.
Code
As mentioned during the introduction, the goal for today’s project is to build a digital hygrometer and thermometer, which essentially involves us reading the current temperature (for thermometer) and humidity (for hygrometer) data from the DHT and display it on the OLED display.
To reduce the amount of code we need to write, we will use two superb libraries; the u8glib, and the DHT library. The DHT library contains functions and methods that allows us to easily obtain temperature and humidity data from the DHT11 while the U8Glib library contains functions which reduce the complications and the amount of code we need to write to display text or graphics on the OLED display.
The libraries can be installed via the Arduino Library Manager or downloaded via the links attached to them, and installed by extracting them into the Arduino Libraries folder.
As usual, I will do a breakdown of the code and explain the functional part of it.
We start the code, by including the libraries that will be used for the project.
//Written by Konstantin Dimitrov
#include <U8glib.h>  // U8glib library
#include <dht.h>     // DHT library
Next, we declare the pin of the Arduino to which the signal/Dout pin of the DHT is connected, and create an instance of the DHT library which will be used to reference it throughout the sketch.
#define dht_apin A0  // Analog pin to which the sensor is connected
dht DHT;
Next, we create an instance of the u8glib Library with pins of the Arduino to which the OLED is connected as arguments. To make the tutorial easy for those who do not have the exact OLED display used in this tutorial, the code contains multiple instances to support diverse kind of OLEDs. Uncomment the one that matches your own display and comment out the others.
Next, we create the function “draw” which is used to achieve all the goals of this project. The function, when called, will obtain temperature and humidity data from the DHT and display it on the OLED.
We start the function by calling the u8g.setFont() method which is used to set the font in which text is displayed on the screen. The U8glib library supports quite a number of fonts, you can find them all here. With the fonts in place, the u8g.drawStr() function is then called to display the strings that show what the data stands for, after which the u8g.print() function is then used to print the values in front of each string. The u8g.setPrintPos() function is used to set the cursor to the right position on the screen before the text is displayed.
void draw(void)
{
u8g.setFont(u8g_font_fub17r); // select font
u8g.drawStr(0, 20, "Temp: "); // put string of display at position X, Y
u8g.drawStr(0, 60, "Hum: ");
u8g.setPrintPos(72, 20); // set position
u8g.print(DHT.temperature, 0); // display temperature from DHT11 in Celsius
u8g.println("C");
u8g.setPrintPos(60, 60); // set position
u8g.print(DHT.humidity, 0); // display humidity from DHT11
u8g.println("%");
}
With that done, we move to the void setup function. The void setup() function for this project will, however, be left blank as we really need not to initialize any of the variables. For other DHT libraries, it might be necessary to call a dht.begin() function under the void setup, but it is not necessary for the library used in this tutorial.
void setup(void)
{
}
Next is the void loop() function. The void loop is simplified due to the Void draw() function which we created earlier. We start the void loop() by calling the DHT.read11() function to obtain temperature and humidity data from the DHT, this data is then displayed on the display by calling the draw() function, allowing a data refresh time of 2 seconds in between reads to ensure the accuracy of the DHT.
void loop(void)
{
DHT.read11(dht_apin); // Read apin on DHT11
u8g.firstPage();
do
{
draw();
} while( u8g.nextPage() );
delay(2000); // Delay of 2 sec before accessing DHT11 (min - 2sec)
}
The complete code for the project is available below and also attached under the download section of the tutorial.
#include <U8glib.h> // U8glib library
#include <dht.h> // DHT library
#define dht_apin A0 // Analog pin to which the sensor is connected
dht DHT;
/*Uncomment and comment*/
U8GLIB_SH1106_128X64 u8g(13, 11, 10, 9, 8);  // DIN=13, CLK=11, CS=10, DC=9, Reset=8
//U8GLIB_SSD1306_128X32 u8g(13, 11, 10, 9, 8); // DIN=13, CLK=11, CS=10, DC=9, Reset=8
//U8GLIB_SSD1306_128X64 u8g(13, 11, 10, 9, 8); // DIN=13, CLK=11, CS=10, DC=9, Reset=8
void draw(void)
{
   u8g.setFont(u8g_font_fub17r);   // select font
   u8g.drawStr(0, 20, "Temp: ");   // put string of display at position X, Y
   u8g.drawStr(0, 60, "Hum: ");
   u8g.setPrintPos(72, 20);        // set position
   u8g.print(DHT.temperature, 0);  // display temperature from DHT11 in Celsius
   u8g.println("C");
   u8g.setPrintPos(60, 60);        // set position
   u8g.print(DHT.humidity, 0);     // display humidity from DHT11
   u8g.println("%");
}
void setup(void)
{

}
void loop(void)
{
   DHT.read11(dht_apin);  // Read apin on DHT11
   u8g.firstPage();
   do
{
   draw();
}  while( u8g.nextPage() );
   delay(2000);  // Delay of 2 sec before accessing DHT11 (min - 2sec)
}
/*END OF FILE*/
Demo
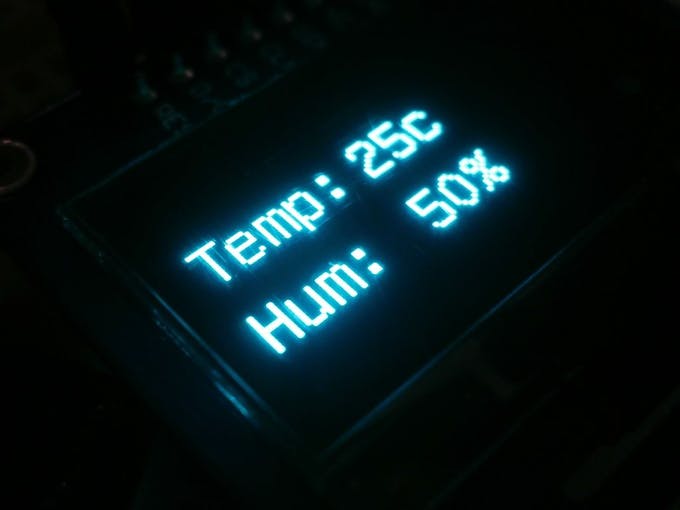
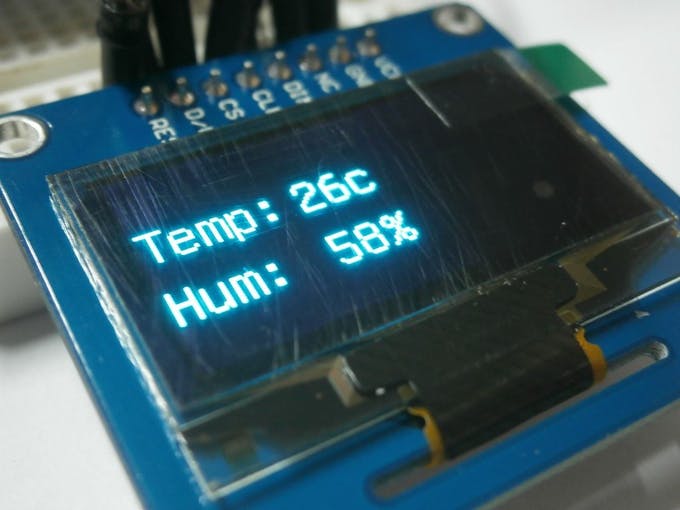
With the sketch complete, go over the connections once again to ensure everything is connected as described under the schematics section. With that done, connect the Arduino to your computer and upload the sketch. After a while, you should see the screen come up with the temperature and humidity information as shown in the image below.
Demo Image Credit: Konstantin Dimitrov
That’s it for this tutorial guys, as with all the other tutorials, these simple tutorials could be important to your startup, business or enterprise. This tutorial could be the building block to build that patient monitor device for hospitals, environmental monitoring devices for farmers, or add connectivity options to it and start sending the data to a web server. Your Imagination is the only limit to the things you can build with borrowed ideas from this project.
This tutorial inspired from Konstantin Dimitrov’s tutorial.
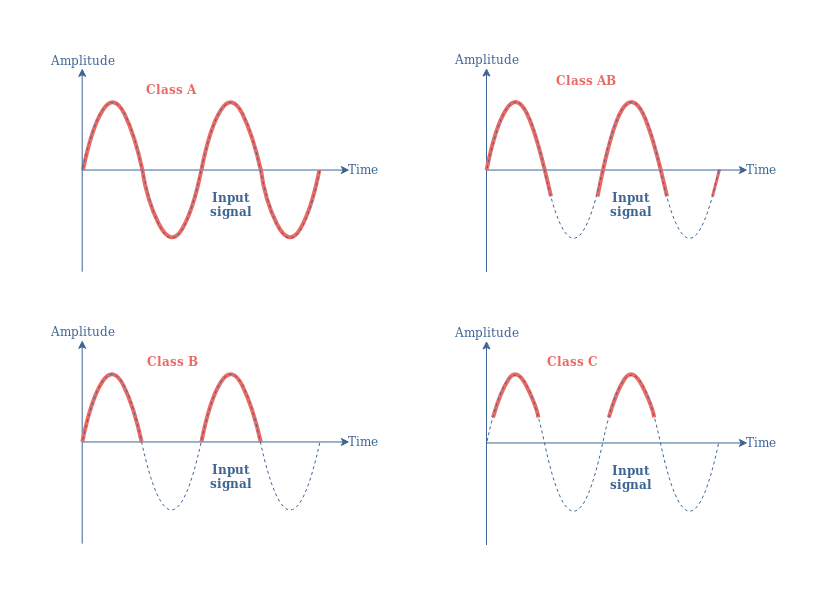
Amplifiers are commonly classified depending on the structure of the output stage. Indeed, the power amplification really happens during that stage and therefore the quality and efficiency of the output signal is dictated by the architecture of the amplifier’s output. The classification consists of an alphabetical arrangement A, B, AB and C that relates to the historical emergence of the amplifiers. During this article, we will give a brief presentation of each amplifier class. Each class denotes the quality of the amplification according mainly to two criteria : the efficiency and the conduction angle.
Amplifier Classes conduction angle
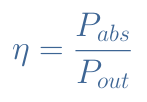
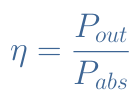
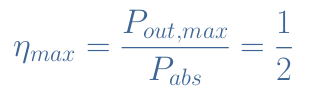
The efficiency η of an amplifier is defined by the following formula :
eq 1 : Definition of the efficiency
Pout is the power at the output, delivered to a load whereas Pabs is the power absorbed by the amplifier.
The conducting angle is a measure of how much of the input signal is used to realize the amplification. This value ranges between 360° or 2π rad to 0° or 0 rad. The upper limit 360° means that 100% of the input signal is used for the amplification process while the lower limit 0° means that no signal is taken. We will clarify this further on.
Note on the biasing
There is a reason, before presenting the different classes of amplifiers, that we speak briefly about the biasing. Indeed, if there is truly something to remember about this tutorial is that the class of an amplifier is fully determined by the biasing applied to the transistor.
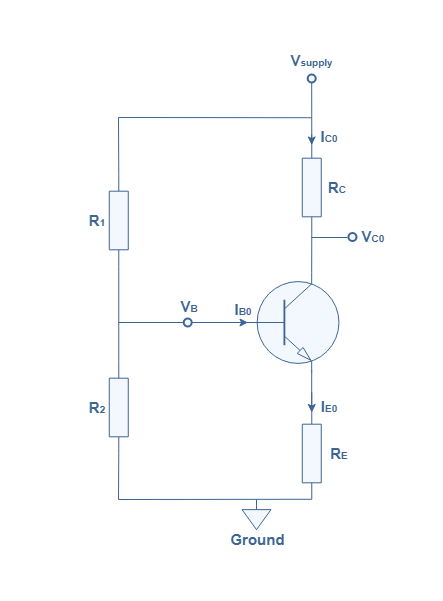
The diagram presented in Figure 1 should be by now familiar :
fig 1 : Voltage divider network
In Figure 1, a BJT transistor of current gain β is biased by a voltage divider network, which consists of two parallel resistances R1 and R2 wired to the base branch. Such as we explain in the tutorial Biasing a BJT, the collector current and voltages when no AC signal is applied (IC0,VC0) sets the operating or quiescent point of the amplifier. The quiescent point is very important because its position in the output characteristic dictates the conducting angle value and therefore the class of the amplifier.
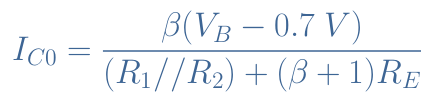
The set of values (IC0,VC0) can be adjusted with the values of the biasing resistances and emitter resistance. Indeed, the collector current IC0 is given by :
eq 2 : Biasing collector current
We can clarify two parameters in Equation 2 : 0.7 V corresponds to the voltage VBE, which is the threshold voltage of silicon-based transistors. The resistance R1//R2 is the parallel equivalent resistance of the biasing circuit and is given by the ratio (R1×R2)/(R1+R2).
And the collector voltage VC0 satisfies :
eq 3 : Biasing collector voltage
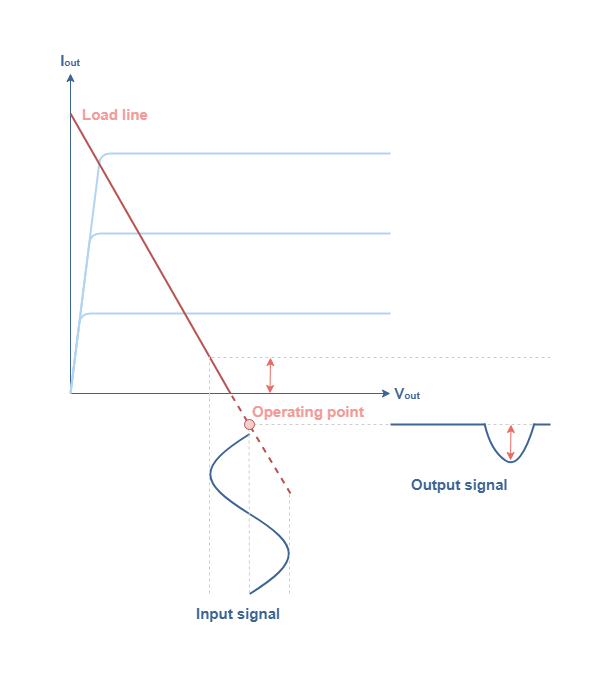
Note that in the following of this tutorial, we will always consider bipolar transistors, but everything we say applies also to other types of transistors such as MOSFETs. Moreover, as a matter of simplification, we use the Common Emitter Amplifier as the configuration under study, the output signals shown in the figures will therefore be inverted.
Class A Amplifier
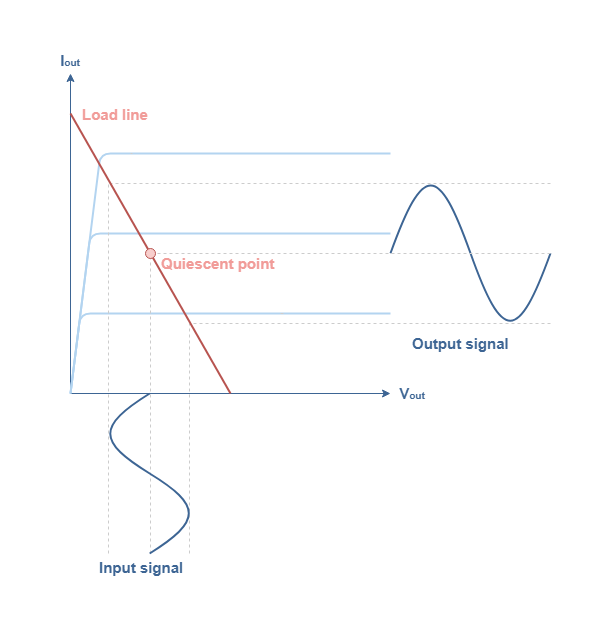
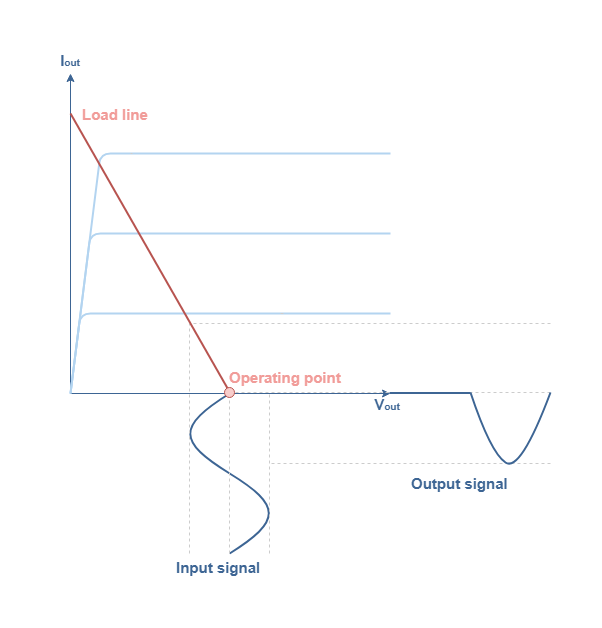
A class A amplifier is characterized by a 360° conduction angle. To achieve this feature, the quiescent point of a Class A amplifier is chosen to be in the middle of the load line such as shown in Figure 2 :
fig 2 : Class A biasing conditions
The quiescent point satisfies IC0=Vsupply/2RC and VC0=Vsupply/2. These formulas along with Equation 2 and Equation 3 enable to choose proper values for the biasing resistances to get a class A amplifier.
The absorbed power of a class A amplifier is a constant and equal to Pabs=Vsupply×IC0. The output power is the product of the rms output current and voltage : Pout=Vout,rms×Iout,rms. The maximal value of Pout is given when the output current reaches the upper limit IC0 and the output voltage reaches the power supply Vsupply : Pout,max=(Vsupply×IC0)/2. The maximal efficiency is therefore :
eq 4 : Maximal efficiency of a class A amplifier
In reality, the efficiency is around 20 to 30 % and 50 % can be achieved with a two transistor configuration. This low efficiency highlights the fact that class A amplifiers use power even when no AC input signals are applied.
Class B Amplifier
Class B amplifiers have been developed as an answer to the low efficiency of class A amplifiers. This class of amplifier is characterized by a 180° conduction angle, that is to say that they use only half of the input signal to realize the amplification process. To achieve a class B amplification, one needs to bias the circuit accordingly with Figure 3 :
fig 3 : Class B biasing conditions
The operating point here is located at the cutoff point and satisfies IC0=0 and VC0=Vsupply.
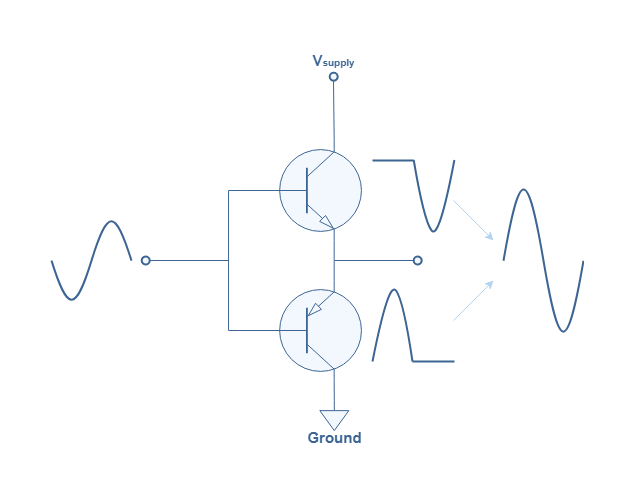
It is pretty obvious that a faithful amplification can not be achieved with a class B amplifier. To solve this problem, one of the most common solution is to use two transistors (one NPN and one PNP) in a so called “push-pull” configuration :
fig 4 : Class B push-pull configuration
The NPN transistor takes care of amplifying the positive signal of the input and the PNP amplifies the negative signal. The combination results in an addition of the two independent amplifications that reproduce the shape of the input signal.
However, there is a phenomenon called the crossover distortion that prevents class B amplifiers, even in a push-pull configuration to give a 100 % faithful amplification. The cause is due to the threshold voltage of transistors (+0.7 V for NPN and -0.7 V for PNP) that creates an interval of 1.4 V where no amplification at all is performed from neither the NPN nor the PNP transistor. The consequence is a distortion of the signal around the 0 V point of the output signal, well known by audiophiles.
Nonetheless, class B amplifier presents the advantage over the class A to be more efficient with a theoretical maximum efficiency ofηmax=78.5 %. The efficiency observed on real configurations however does not exceed 70 %.
Class AB Amplifier
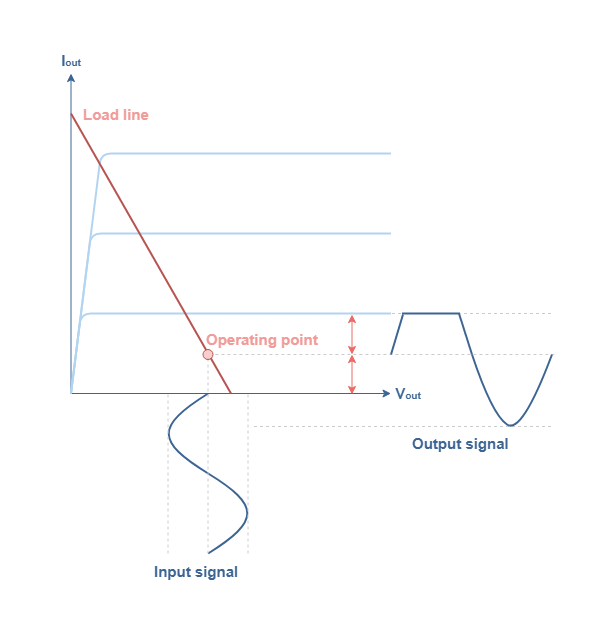
As the name refers to, class AB amplifier behaves as a combination of class A and class B amplifiers. It has been developed in order to overcome the low efficiency of the class A and the distortion of the class B. Class AB amplifiers are characterized by a conduction angle in the interval ]180°;360°[. The operating point given by the bias circuit is located between a class A quiescent point and the cutoff point :
fig 5 : Class AB biasing conditions
The operating point of a class AB amplifier satisfies : 0<IC0<Vsupply/2RC and Vsupply/2<VC0<Vsupply.
When the operating point is closer to the cutoff point, the amplifier “becomes” more as a class B than a class A : the signal gets more distorted but the efficiency increases. At the opposite, when the operating point approaches the quiescent point in the middle of the load line, the amplifier behaves more as a class A than a class B : the output is more faithfully reproduced but the efficiency decreases.
Since class AB amplifiers offer a good compromise between the advantages of linearity of class A and the good efficiency of class B, they are commonly used today in many applications. They are usually found in a push-pull configuration, such as presented in Figure 4 and they even eliminate the crossover distortion during the addition of the two amplified outputs from the NPN and PNP transistors.
Class C Amplifier
The last most common class of amplifiers is the class C. It is characterized by a small conduction angle that is in the interval ]0°;90°[. The operating point of class C is beyond the cutoff point, aligned with the load line but in the region of negative biasing currents :
fig 6 : Class C biasing conditions
As a matter of fact, the operating point of a class C satisfies : IC0<0 and VC0>Vsupply (which makes sense from Equation 3 if IC0<0).
The high distortion produced by class C amplifiers can be processed by a parallel resonance circuit L//C that consists of an inductance (L) and a capacitance (C). This circuit can indeed convert the output pulses into complete sine waves. For this reason, class C amplifiers are used in high frequency applications.
The biggest advantage of a class C amplifier is its efficiency that is above 78.5 % and can approach 100 % depending how far the operating point is from the cutoff point.
Conclusion
We have seen during this introduction to amplifier classes that for a given configuration (MOSFET, Common Emitter …), the biasing circuit influences heavily the behavior of an amplifier. The way that the amplifiers are biased can be categorized into four main classes :
Class A : The operating point is in the middle of the load line. It has the highest linearity, but the lowest efficiency around 20-30 %. This class is very much appreciated by audiophiles that consider it to reproduce the purest sound.
Class B : The operating point matches the cutoff point of the load line. It has a good efficiency of around 70 %, but creates a crossover distortion when used in a push-pull configuration.
Class AB : The operating point is between the middle and the cutoff point of the load line. It combines both advantages of the class A and B by having a reasonable efficiency above 50 % and a good linearity when used in a push-pull configuration. The class AB is therefore commonly found at the output stage of many applications : audio amplifiers, function generator …
Class C : The operating point is beyond the cutoff point. It has the highest efficiency above 80 %, but the lowest linearity. Class C amplifiers are restricted to be used for high-frequency applications.
Later, after the development of these technologies, other classes of amplifiers have been developed to answer specific problems, mostly for high-frequency applications. We can mention for example :
Class D : They are non-linear amplifiers and their efficiency is very high (close to 100%). They are commonly known as PWM amplifiers (Pulse Width Modulation). Class D amplifiers are used in a push-pull configuration and give as an output signal impulsion that can easily be filtrated with inductance and capacitor to reproduce the original desired shape.
Class E : They are used to amplify RF frequencies from 3 MHz to 10 GHz. Class E amplifiers offer for the upper frequency limit a good efficiency above 70 %.
In the next tutorials, we will give much more detail about each of the most common classes : A, B and AB.
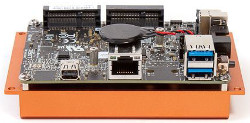
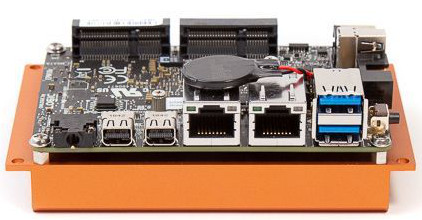
Four “EPM16x”-branded Pico-ITX SBCs has just been launched by Logic Supply. The boards, while compatible with Windows, come Ubuntu-Ready and are available in individual quantities starting at only $245 to $426 without SSD storage.
The four boards include the EPM160, EPM161, EPM162 and the EPM163. The EPM160, EPM161, and EPM162 are based on the Intel’s dual-core Celeron N3350 while the top-of-the-line, leader of the pack, EPM163, is based on the quad-core Pentium N4200. The EPM16x boards all come with a MicroSD slot, as well as a USB 2.0 port and a serial header. Although the EPM162 and EPM163 have only two mini-DP connections, Logic Supply mentions that they support triple independent displays, presumably with the addition of a mini-PCIe or USB 3.0 add-on.
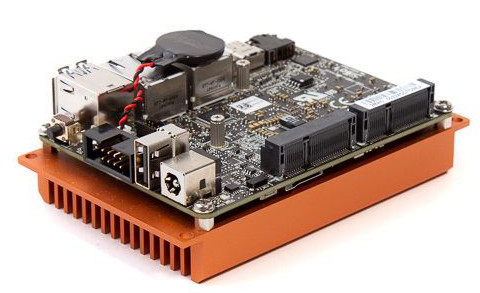
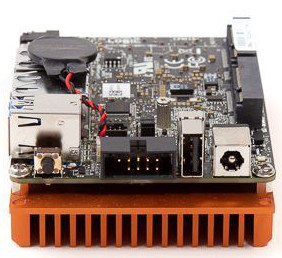
While the boards are the same in more ways than one, some of its features like the eMMC capacity improves as you go higher, for instance, like the $426 EPM163 which comes with a Pentium N4200, 4GB LPDDR4, 64GB eMMC, mSATA, mini-PCIe, and 2x each of GbE, DP, and USB 3.0 ports, the EPM162, even though based on the same processors, moves up from the EPM161(2GB RAM) and the EPM160 (1GB RAM) with a 4GB(LPDDR4) RAM, an audio jack, dual 4K-ready mini-DP and GbE ports instead of one.
While WiFi is not a feature or an option on any of the boards, they come with an half-height mini-PCIe slot for WiFi, 4G, or other add-ons, as well as an mSATA-ready, full-size mini-PCIe which is perfectly compatible with the 32GB-1TB mSATA SSDs sold by Logic Supply.
Specifications listed for the EPM16x SBCs include:
Processor — Intel Apollo Lake with Intel HD Graphics 500:
1x (160, 161) or 2x (162, 163) mini-DisplayPorts with 4K
Optional Consumer Electronics Control (CEC) module
Audio I/O jack (162 and 163 only)
Other I/O:
2 USB 3.0 ports
1x USB 2.0 port
1x RS-232 header
Expansion:
Full-height mini-PCIe slot with mSATA support
Half-height mini-PCIe slot
Other features — IP50 protection; system monitoring; optional heatsink, motherboard test and display and COM cables; 2-year warranty (opt. 3-year)
Operating temperature — 0 to 40°C
Power — 12V DC jack (AC/DC adapter on 162); power button and LED; optional auto power on feature
Dimensions — 100 x 73 x 22mm (114 x 73 x 39.5mm with heatsink)
Operating system — barebones; Ubuntu Desktop or Server 16.04 LTS or 18.04 LTS ($10); Windows 10 IoT Enterprise ($100).
Further information
The EPM160, EPM161, EPM162, and EPM162 Pico-ITX boards are available now starting at $245 each. More information may be found on Logic Supply’s EPM160, EPM161, EPM162, and EPM163 product and shopping pages for each of them.
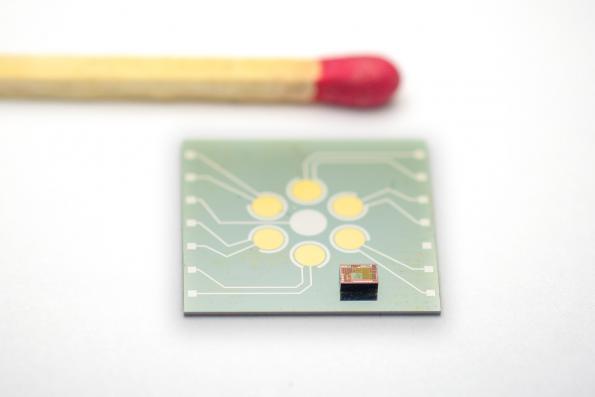
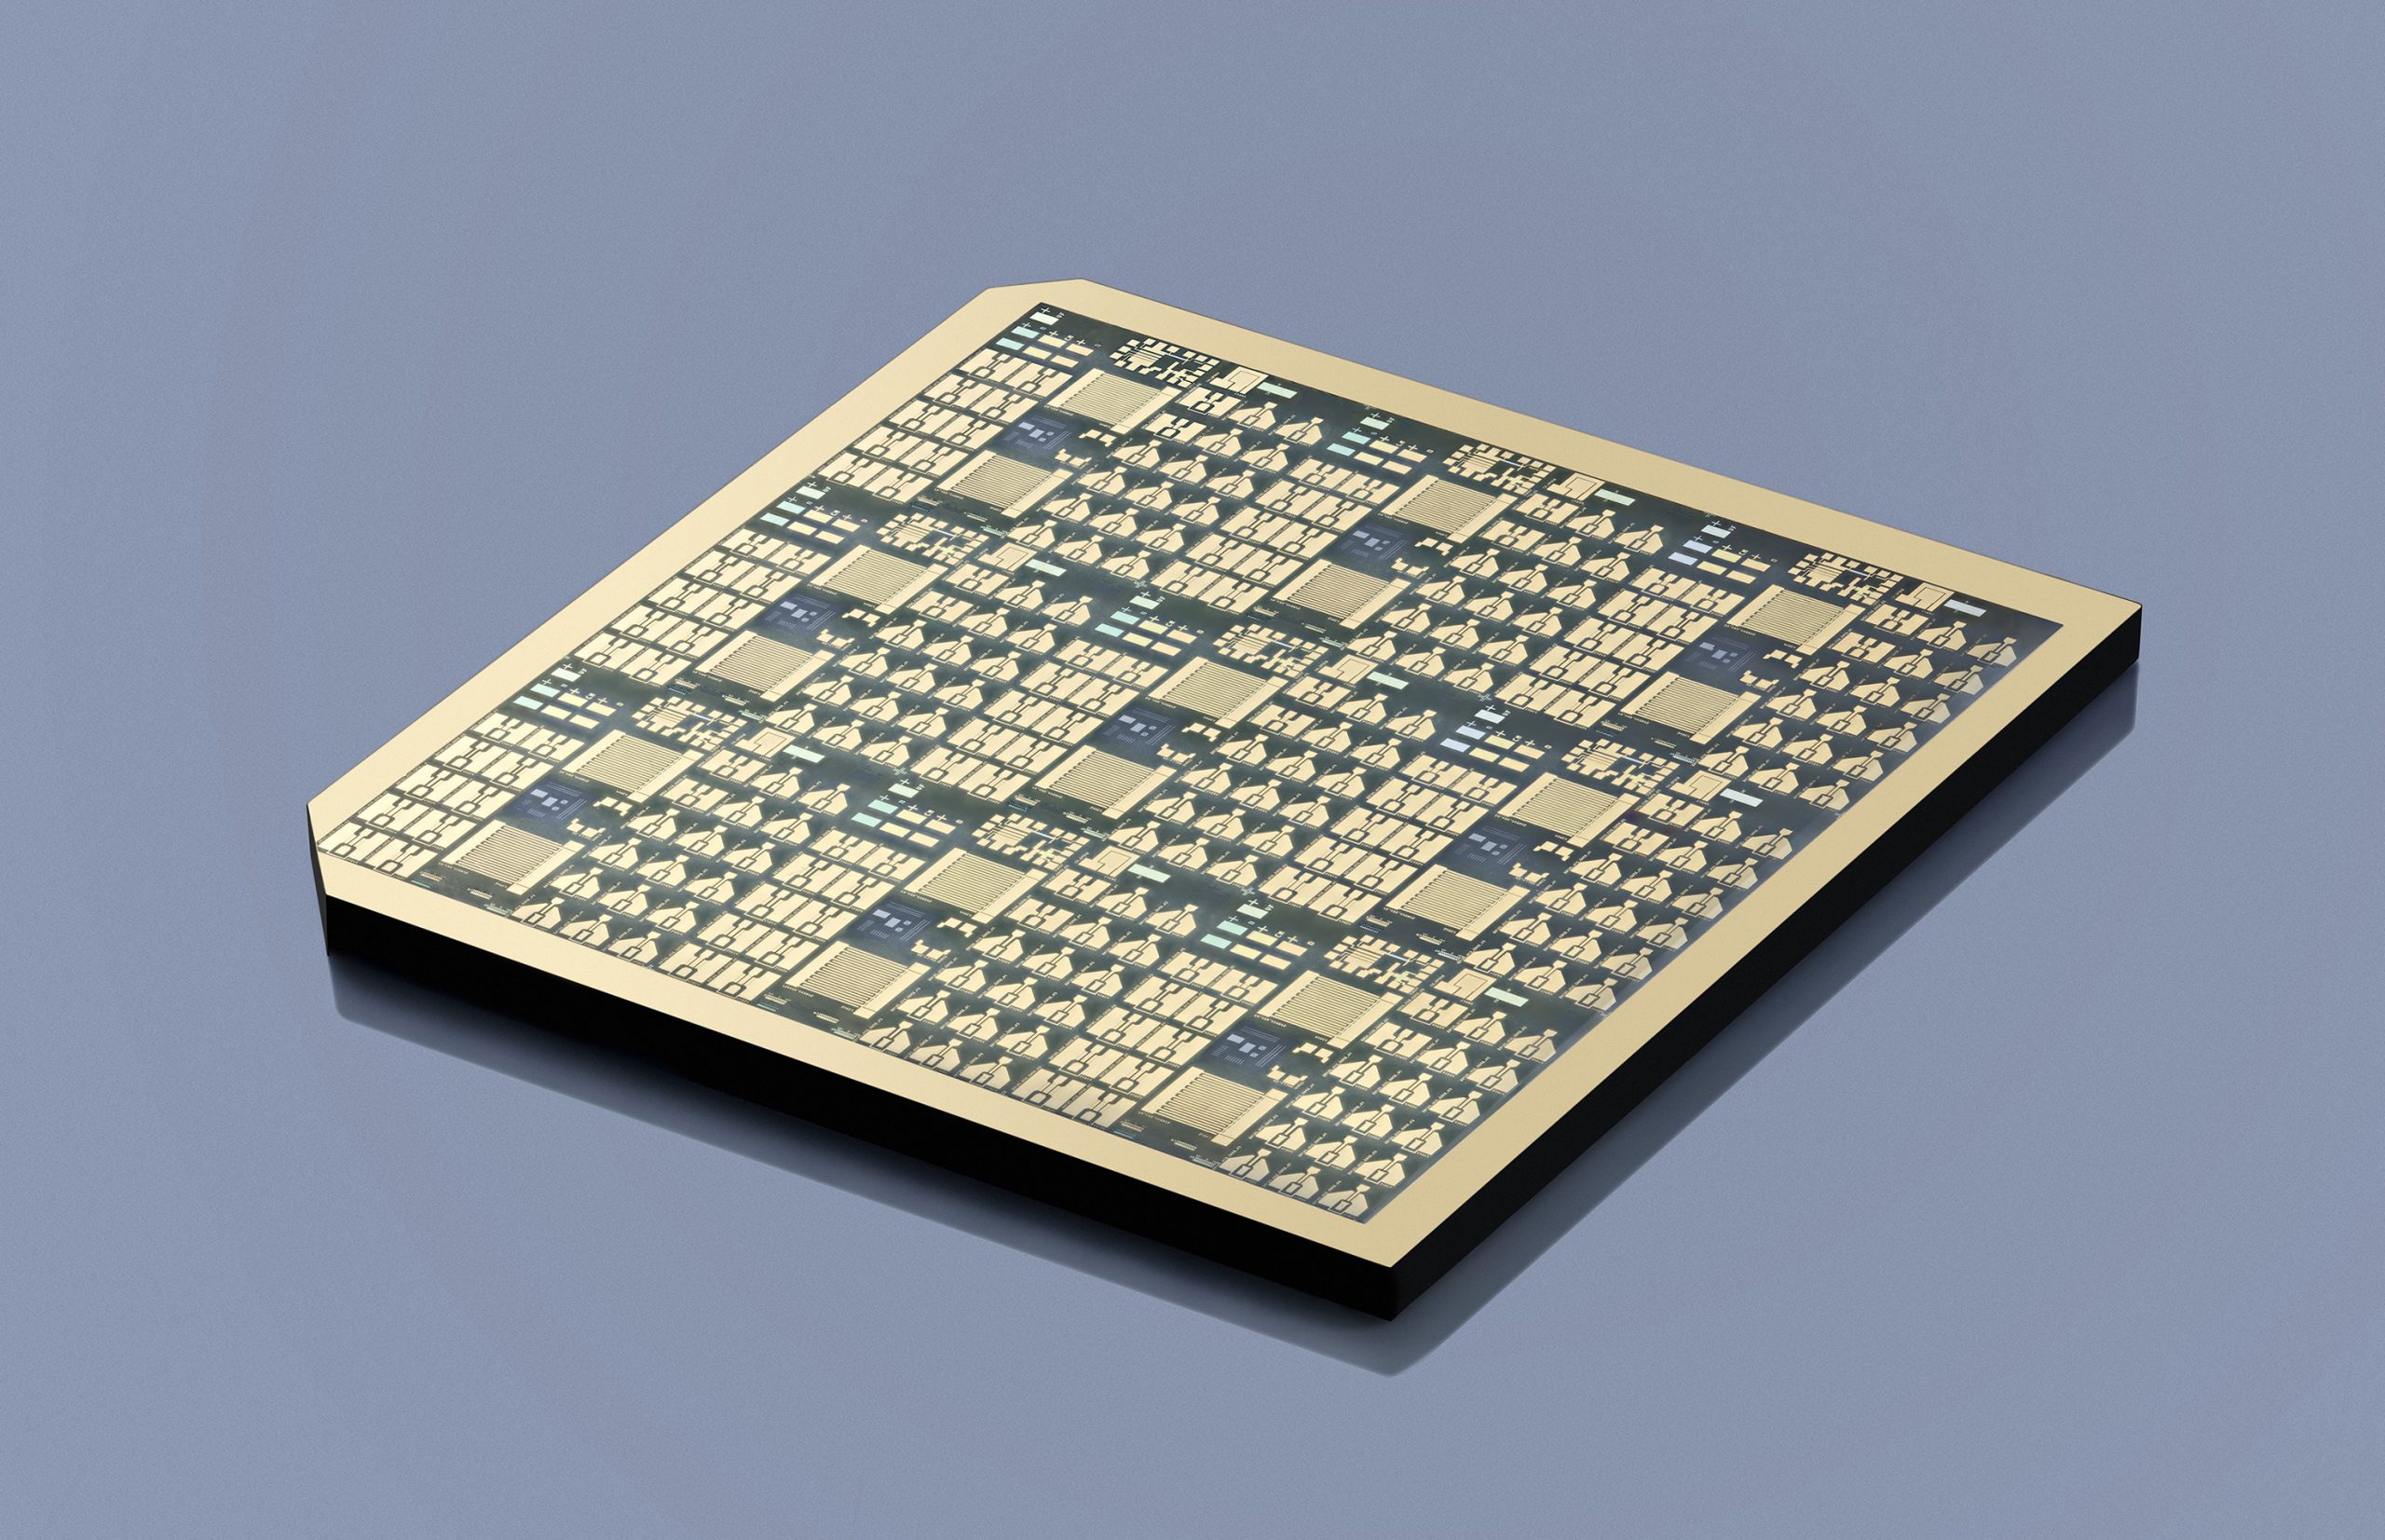
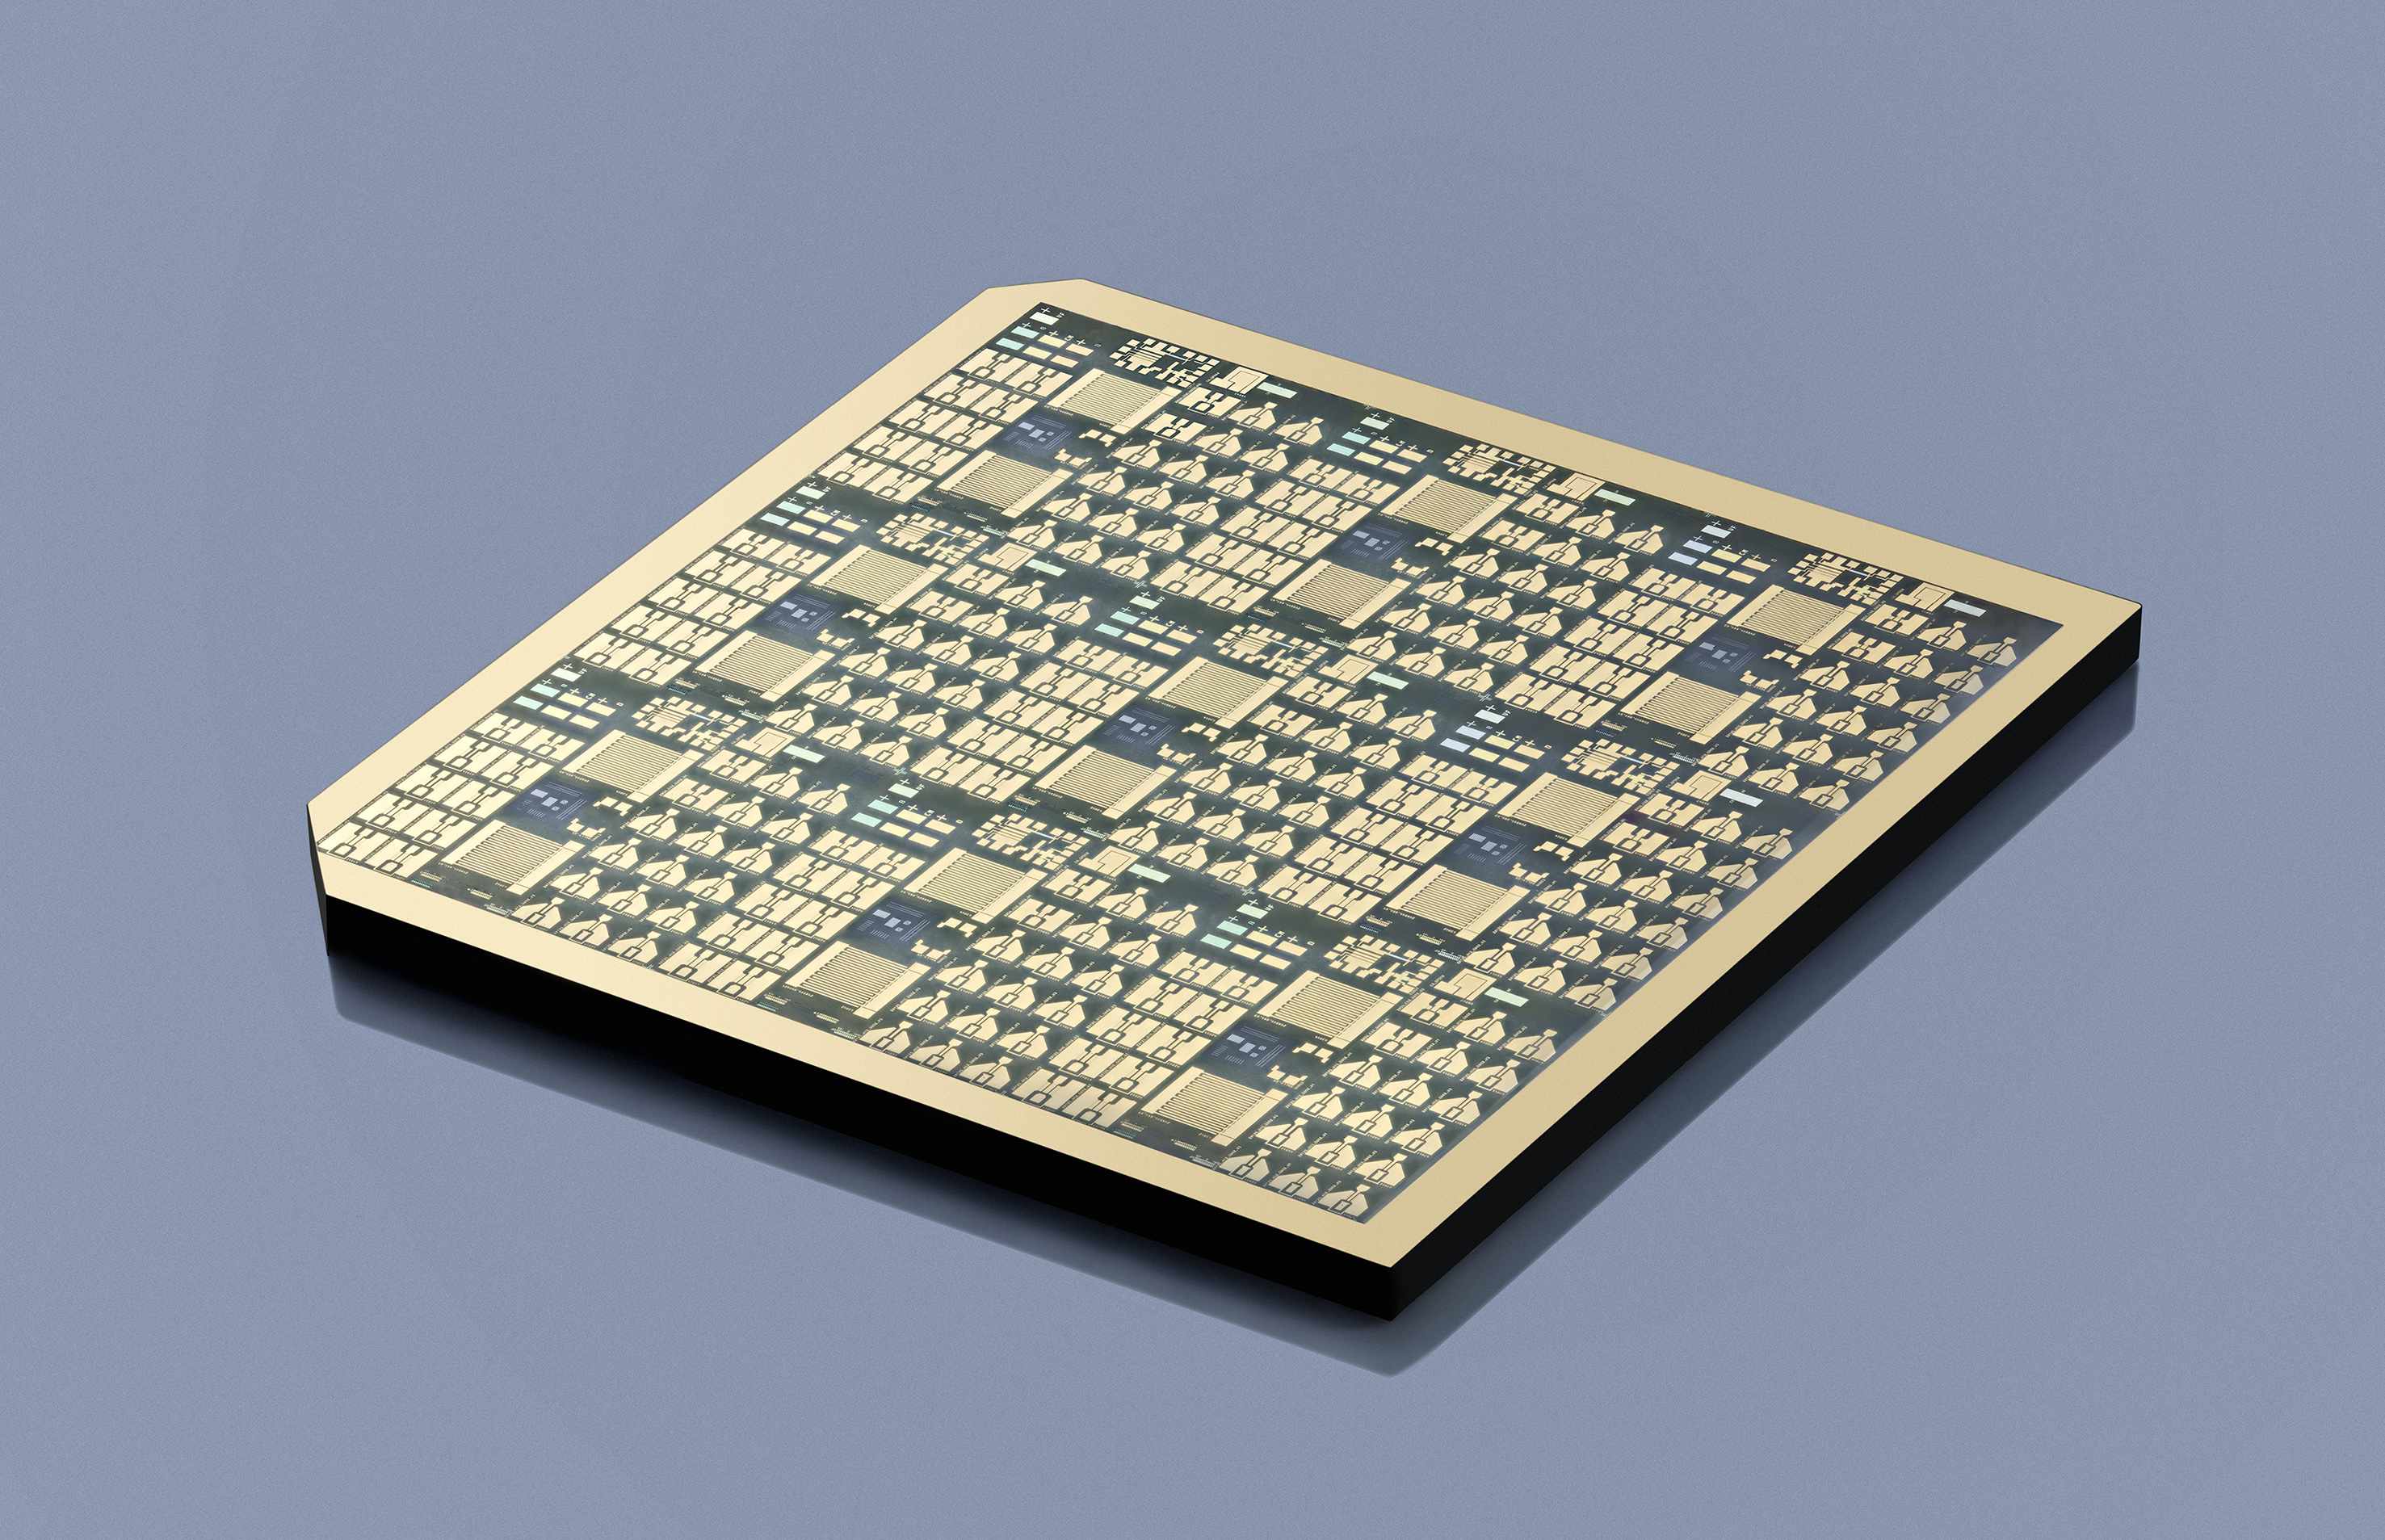
Galliumoxid-Chip, Transistor- und Messstrukturen, hergestellt am Ferdinand-Braun-Institut, Berlin mittels Projektionsbelichtung gallium oxide chip, transistor structures and for measurement purposes, processed at Ferdinand-Braun-Institut, Berlin, using projection lithography
The Ferdinand Braun Institute for Highest Frequency Technology (FBH) in Berlin has achieved a breakthrough with transistors based on gallium oxide (ß-Ga2O3).
The ß-Ga2O3 gallium oxide MOSFETs developed by FBH scientists provide a high breakdown voltage with high current conductivity. With a breakdown voltage of 1.8KV and a record power density of 155 megawatts per square centimetre, they achieve worldwide unique characteristics close to the theoretical material limit of gallium oxide. At the same time, the breakthrough field strengths achieved are far above those of established wide band gap semiconductors such as silicon carbide (SiC) or gallium nitride (GaN).
In order to achieve these improvements, the FBH team started with the layer structure and the gate topology. The basis was provided by substrates from the Leibniz Institute for Crystal Growth (IKZ) with an optimized epitaxial layer structure. This reduced the defect density and improved the electrical properties. This leads to lower resistances in the switched-on state. The gate is the central “switching point” for field effect transistors, which is controlled by the gate source voltage. Its topology has been further developed to reduce the high field strengths at the gate edge. This in turn leads to higher breakdown voltages.
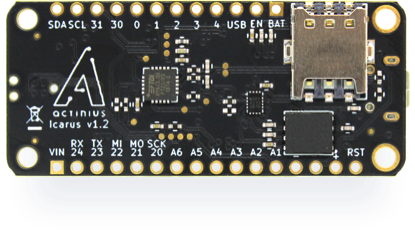
More-powerful, low-power Icarus IoT Board sells at €99,50
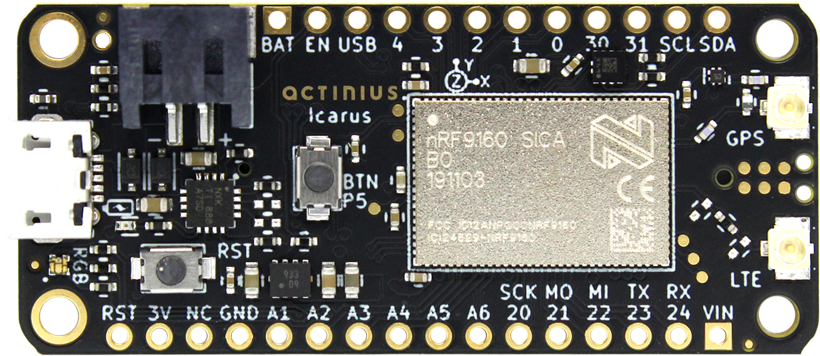
Low-power, cost-effective Icarus IoT board built with the newest nRF91 modem from Nordic Semiconductor combines the latest technological features in the market and integrates the use of GPS and cellular data (LTE-M / NB-IoT) all in one to offer an endless range of possibilities. The new offering from Actinius delivers better specs at a relatively lower price. The board sells at €99,50 (exclusive of VAT) and comes with 3 months free LTE-M data for testing your prototype. With Icarus board, you can get your project online anywhere, anytime, monitor or keep track of any asset, fleet or cargo.
This 50.8mm X 22.8mm board can be used anywhere and anytime as it can be powered from any combination of battery, USB, or VIN (e.g. solar panel). It operates on a nominal operating input voltage of 4.35V – 10.2V and a maximum input voltage (safe rating) of 28V. The board is fully form-factor compatible with the Adafruit Featherwing, so you can install several extra components to the extension pins. It has an in-built over-voltage and under-voltage protection, with a USB-friendly Li/Ion/LiPolymer charger with MPPT, low-noise and incredibly low power consumption rate with power supply output up to 400mA.
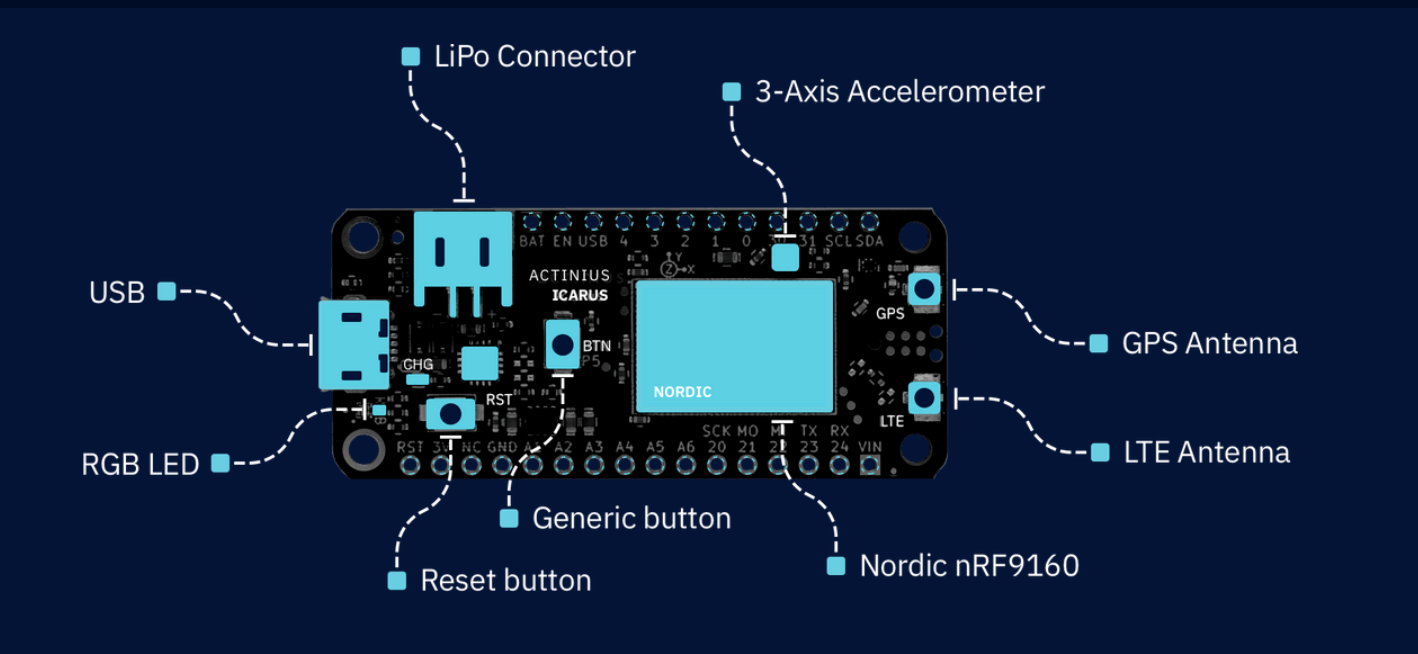
Board Layout
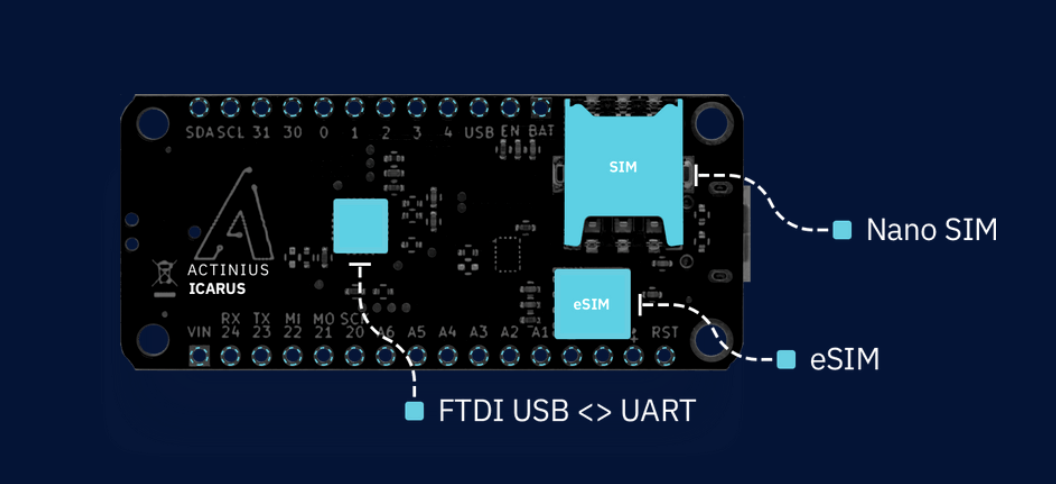
The Icarius IoT board is a true IoT development board with several connectivity options including a Nano-SIM and Embedded SIM, support for LTE Cat-M1 and LTE Cat-NB1 aka NB-IoT providing Global coverage with PSM and eDRX being supported. It also onboard supports security with several features including; the ARM® Trustzone®, the ARM® Cryptocell 310, SSL/TLS support, and it’s being supported by the OTAU Platform of Actinius for always secure and up-to-date firmware.
For sensors and on-board peripherals, the board uses RGB Led, GPS, reset and general-purpose buttons, battery voltage reader and a low power 3-axis accelerometer. Other great specs include:
18x general-purpose IO
Up to 6x 12-bit, 200 ksps ADC with EasyDMA
4x 12C master/slave with EasyDMA that can be mapped to any pin
4x UART with EasyDMA
4x pulse width modulator with EasyDMA
An Inter-IC sound Interface of 12S with EasyDMA
Digital microphone interface (PDM) with EasyDMA that can be mapped to any pin
4x SPI master/salve with EasyDMA
Serial Wire Debug (SWD) on 6-pin
ARM Cortex M33 processor
1MB Flash
256 kb RAM
power-saving mode and an extended discontinuous reception
The board comes pre-programmed with a firmware application that initializes peripherals and starts at AT host. If you are just getting started with the Icarus IoT board, check out more information on https://www.actinius.com/icarus
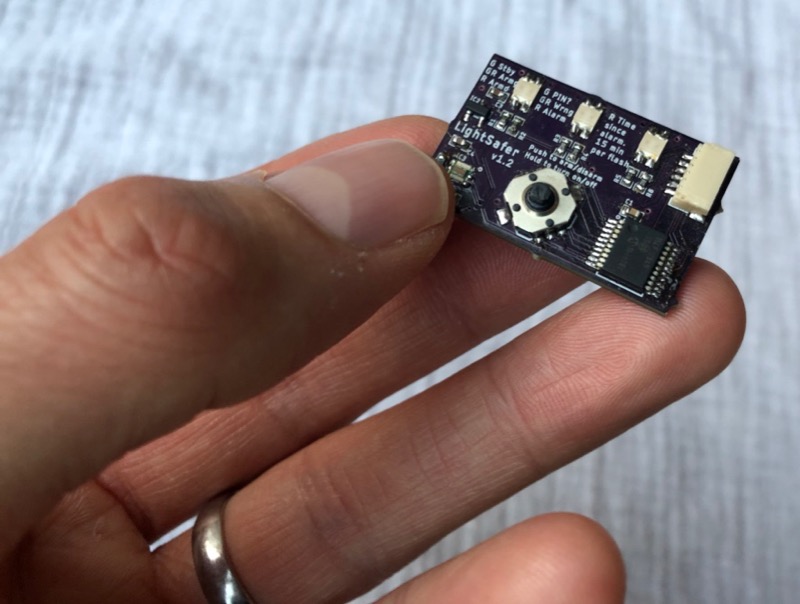
Andy C @ burningimage.net build a tiny board that is able to monitor possible activity on your hotel’s safe, so to be sure that nobody has access to it. He writes:
I wanted a simple device that would tell me if somebody had been in my hotel safe whilst I was out on holiday, so I designed LightSafer. LightSafer is a tiny 33 x 21 mm (1.3 x 0.8 inch) gadget with PIN code entry that lets you know if somebody has been snooping around in your hotel safe (or sock drawer).
It’s completely silent. You just press the button to arm LightSafer, put it in your safe and if anybody opens the safe and fails to enter the correct PIN, the alarm LED lights. Once the alarm is triggered there is no way to turn it off. Even if the battery is removed, as soon as a new one is put in, the alarm LED lights straight back up.
Entering the correct PIN is the only way to disable the alarm.
LightSafer – Lets you know if somebody has been snooping around in your hotel safe – [Link]
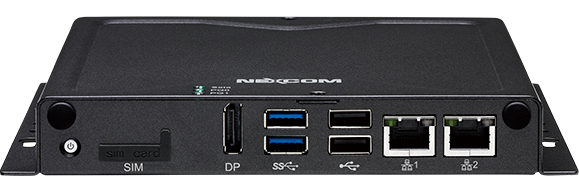
Powered by Intel® Celeron® processor, the slim box computer NISE 51 featuring multiple I/O design and the capability to meet customers’ need is the key for M2M intelligent system as an intelligent IoT gateway.
Rich I/O Design in Slim Footprint
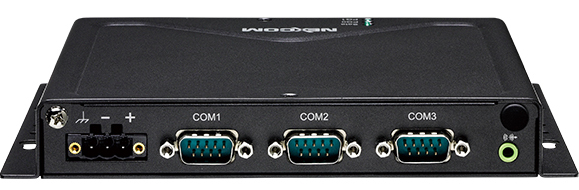
Flexible connectivity to communication devices is inevitable for the use of predictive maintenance applications. With slim size of 162mm (W) x 26mm (H) x 150mm (D), NISE 51 provides a variety of connectivity for customer to choose from. First, NISE 51 comes with 3 COM ports that allow legacy connectivity via RS232/RS422/RS485 for Modbus communication. Secondly, Ethernet-based LAN port is equipped to ensure device communication for management. NISE 51 also has wireless connectivity for IoT applications by supporting mini-PCIe and M.2 devices such as Wi-Fi, Bluetooth, 3.5G and 4G LTE module.
Instead of HDMI, NEXCOM NISE 51 supports DP display output to keep up with future trend. The DP connectivity also comes with lockable design on the cable side to assure image is securely displayed. Despites the I/O mentioned above, a SIM card slot and total of 4 USB ports are also included. With such rich I/O design, NISE 51 is capable of monitoring valuable assets accurately for customer and further performing predictive maintenance on equipments for smart factory.
Satisfy Diverse Needs
NISE 51 has the ability to meet various working conditions. It supports both 12V and 24V DC input with operating temperature from -5°C up to 55°C. It is also compatible to different operation systems, including Linux and windows 10. Not only that, NEXCOM understands system requirements vary from different usage of market applications as some are looking for an affordable box computer to decrease business budget. NISE 51 with the latest generation of Intel® Celeron® Apollo Lake processor is a price competitive model that suits cost-sensitive customer best. Additionally, TPM2.0 chip is built to support highest level of data encryption.
Capable of realizing security and connectivity, NISE 51 plays a vital role of the intelligent IoT gateway and can be widely used for a variety of factory automation applications, such as automated warehouse picking system, delivery service and manufacturing and processing systems.
2 x Intel® I211AT GbE LAN ports; support WoL, teaming and PXE
2 x USB 2.0
2 x USB 3.0
1 x mini-PCIe sockets for optional Wi-Fi/3.5G/LTE module
2 x M.2 slot for Wi-Fi/Bluetooth and storage/LTE modules
2 x RS232, 1 x RS422/485 with auto flow control
Support -5~55 degree C operating temperature
Support 12V and 24V DC input
Smart Factory Acceleration with IoT Studio
NEXCOM IoT Studio is a powerful web-based configuration tool for IoT applications. By delivering data extraction from intuitive user interface, NISE 51 together with IoT Studio helps shortening smart factory deployment by accelerating click-to-cloud service for both public and enterprise cloud.
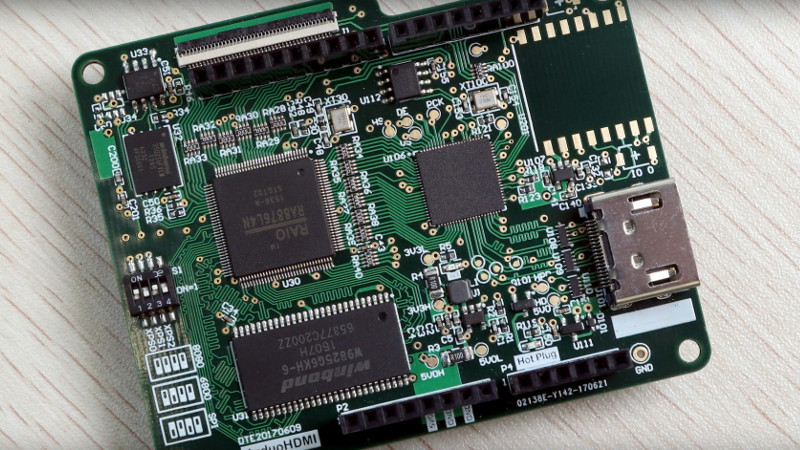
With an Application Specific Integrated Circuit (ASIC), creating HDMI video signals for full HD monitors or HDTVs using a typical modern MCU is difficult but it is not an impossible task. For a resolution as high as 1080p, Full HD Monitors or High Definition Televisions require a pixel clock of 148MHz. To think that such pixel clock can be possible from a simple microcontroller seems unimaginable, but not so for Techtoys who has created an Arduino shield that creates an HDMI output from an SPI control input.
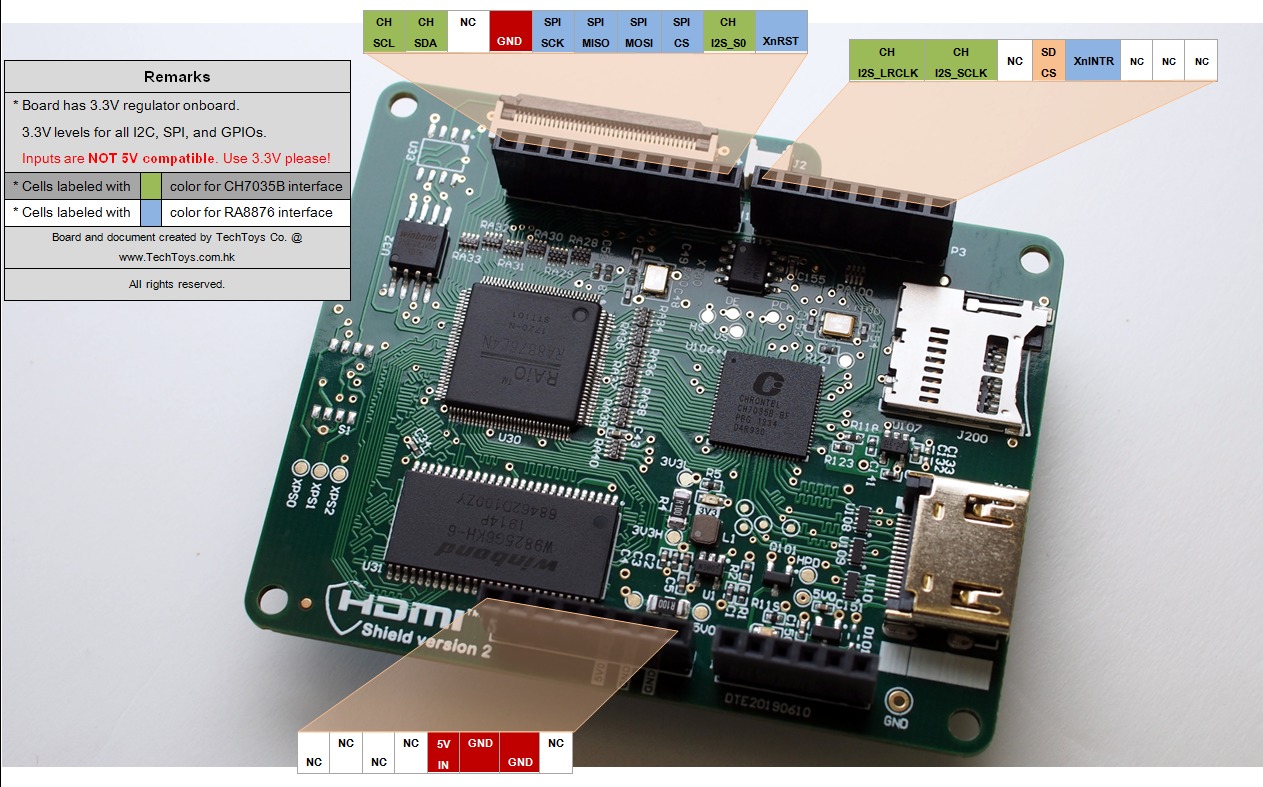
The HDMI shield, an Arduino compatible development board, and two Integrated Circuits give us an insight into how it creates graphics at this level; the RA8876 TFT controller, a full graphics engine and the HDMI encoder CH7035B. The TFT controller RA8876 produces digital RGB output in 8:8:8 format for the HDMI encoder CH7035B converts the RGB video to differential signals (TMDS), with its internal frame buffer that boosts the 8:8:8 RGB to full HD 1080P (1920 * 1080) at 60Hz max. This is particularly interesting because the RA8876 supports a variety of AP interfaces like 8080 16-bit, 4-wire SPI and I2C that should be able to talk to most microcontrollers. The RA8876 also makes it possible to avoid direct pixel rendering, writing simple commands (through the SPI) to define the window size and foreground color instead of writing individual pixels for the 1280 * 720 screen in 16 bit-per-pixel.
example : Ticket Display System
To display full-color pictures, the HDMI Shield uses a free conversion tool that exports binary files from jpeg/png/BMP images to a microSD card and later to the main window by 2D BitBlt in a flicker-free operation. The HDMI shield can also do more interesting things like font rendering from embedded characters, picture-in-picture, DMA transfer from Serial Flash to SDRAM and hardware-accelerated shape-draws.
As this board shows, the classic Arduino shield form factor, though may now be a little past its zenith, can still be relevant for some interesting new applications. However, it is important to note that the HDMI shield is a 3.3V system that stands the risk of being damaged if used with a 5V Arduino.