In the last tutorial, we examined How to connect your IoT devices to the Arduino IoT Cloud, and we saw how to send and receive data, from and to the cloud. With multiple cloud solutions available for IoT devices, there might be a need for you to work with one not as traditional as the Arduino IoT cloud. To help you prepare, for today’s tutorial, we will look at how to build IoT devices that interact with the Adafruit IO.
Adafruit IO represents Adafruit’s desire to continually develop solutions that support makers and hardware enthusiasts in general. It is essentially an integrated cloud service for IoT devices designed primarily, like most other cloud services, to retrieve and store data. However, to make things more suitable for use by its target audience, Adafruit included features that facilitate real-time data visualization using graphs, gauges, etc., Email/webhook notifications, and Control of devices from the internet. It also features IFTTT and zapier integrations which give us the ability to interact with 100s of web services like RSS feeds and Twitter. It comes with a limited but wholly sufficient free plan as well as a paid plan which gives full unrestricted access for around 10$/month.
IoT devices typically perform tasks involving; either sending data to the cloud or receiving data commands from the cloud, as such, in today’s tutorial will have a two-part tutorial to cover both aspects. For the first part, we will obtain temperature, humidity, atmospheric pressure, and light intensity data from the environment and send it to Adafruit IO where it will be displayed on a dashboard and updated every 2s. To provide an offline view of the data, we will use a 1.44 Adafruit TFT LCD display. You can check some of our past tutorials using the 1.44″ TFT display to better understands how it works.
The second part of the tutorial will be used to demonstrate how to control the device from the cloud. We will set up an on/off button on the cloud which when pressed, will show the corresponding text on a display.
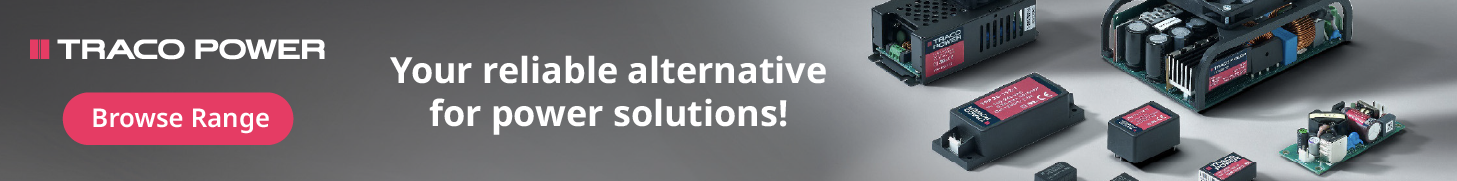
To make all of this happen, at the center of today’s project is the Arduino MKR WiFi 1010 board. It is one of the latest boards of the Arduino line and is a significantly improved version of the MKR 1000 WiFi. It’s equipped with an ESP32 module made by U-BLOX with the aim of speeding up and simplifying the development of WiFi-based IoT applications, leveraging on the flexibility and low power consumption of the ESP32 module.
Getting Started with Adafruit.io IoT Cloud Platform – [Link]
In the last tutorial, we examined How to connect your IoT devices to the Arduino IoT Cloud, and we saw how to send and receive data, from and to the cloud. With multiple cloud solutions available for IoT devices, there might be a need for you to work with one not as traditional as the Arduino IoT cloud. To help you prepare, for today’s tutorial, we will look at how to build IoT devices that interact with the Adafruit IO.
Adafruit IO represents Adafruit’s desire to continually develop solutions that support makers and hardware enthusiasts in general. It is essentially an integrated cloud service for IoT devices designed primarily, like most other cloud services, to retrieve and store data. However, to make things more suitable for use by its target audience, Adafruit included features that facilitate real-time data visualization using graphs, gauges, etc., Email/webhook notifications, and Control of devices from the internet. It also features IFTTT and zapier integrations which give us the ability to interact with 100s of web services like RSS feeds and Twitter. It comes with a limited but wholly sufficient free plan as well as a paid plan which gives full unrestricted access for around 10$/month.
IoT devices typically perform tasks involving; either sending data to the cloud or receiving data commands from the cloud, as such, in today’s tutorial will have a two-part tutorial to cover both aspects. For the first part, we will obtain temperature, humidity, atmospheric pressure, and light intensity data from the environment and send it to Adafruit IO where it will be displayed on a dashboard and updated every 2s. To provide an offline view of the data, we will use a 1.44 Adafruit TFT LCD display. You can check some of our past tutorials using the 1.44″ TFT display to better understands how it works.
The second part of the tutorial will be used to demonstrate how to control the device from the cloud. We will set up an on/off button on the cloud which when pressed, will show the corresponding text on a display.
To make all of this happen, at the center of today’s project is the Arduino MKR WiFi 1010 board. It is one of the latest boards of the Arduino line and is a significantly improved version of the MKR 1000 WiFi. It’s equipped with an ESP32 module made by U-BLOX with the aim of speeding up and simplifying the development of WiFi-based IoT applications, leveraging on the flexibility and low power consumption of the ESP32 module.
Arduino MKR WiFi 1010
The board is made up of three main blocks:
SAMD21 Cortex-M0+ 32bit Low Power ARM MCU
U-BLOX NINA-W10 Series Low Power 2.4GHz IEEE® 802.11 b/g/n Wi-Fi
ECC508 Crypto Authentication
The MKR WIFI 1010 includes a 32-bit computational power, the usual rich set of I/O interfaces associated with Arduino boards, and a low power Wi-Fi with a Cryptochip for secure communication using SHA-256 encryption. All these features can easily be programmed using Arduino Software (IDE) for code development and programming.
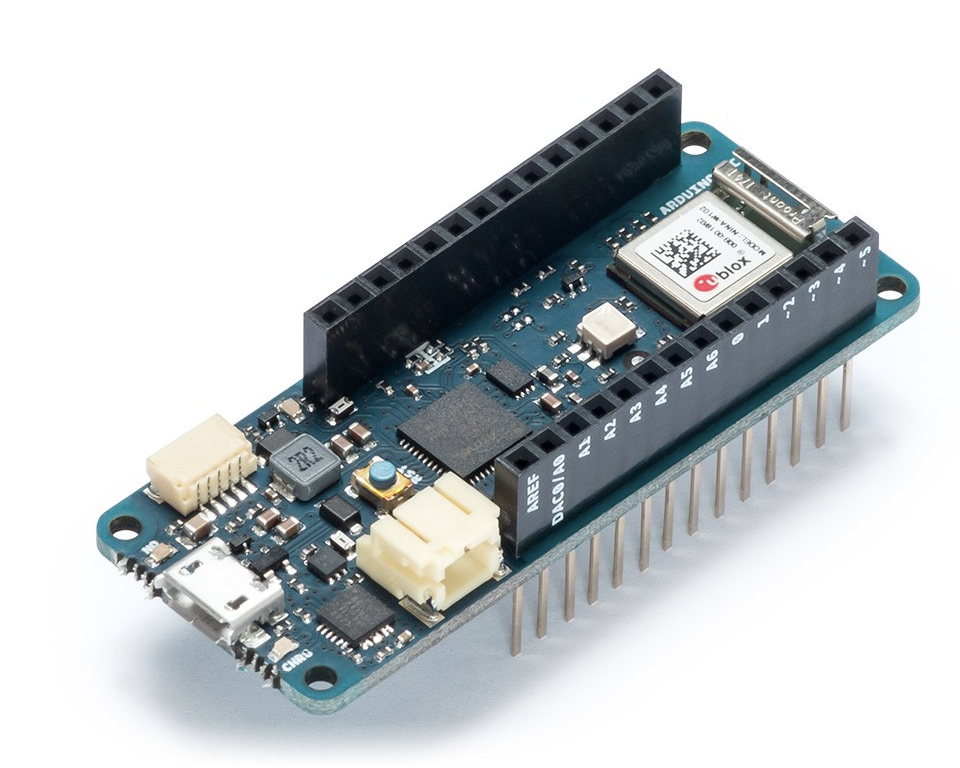
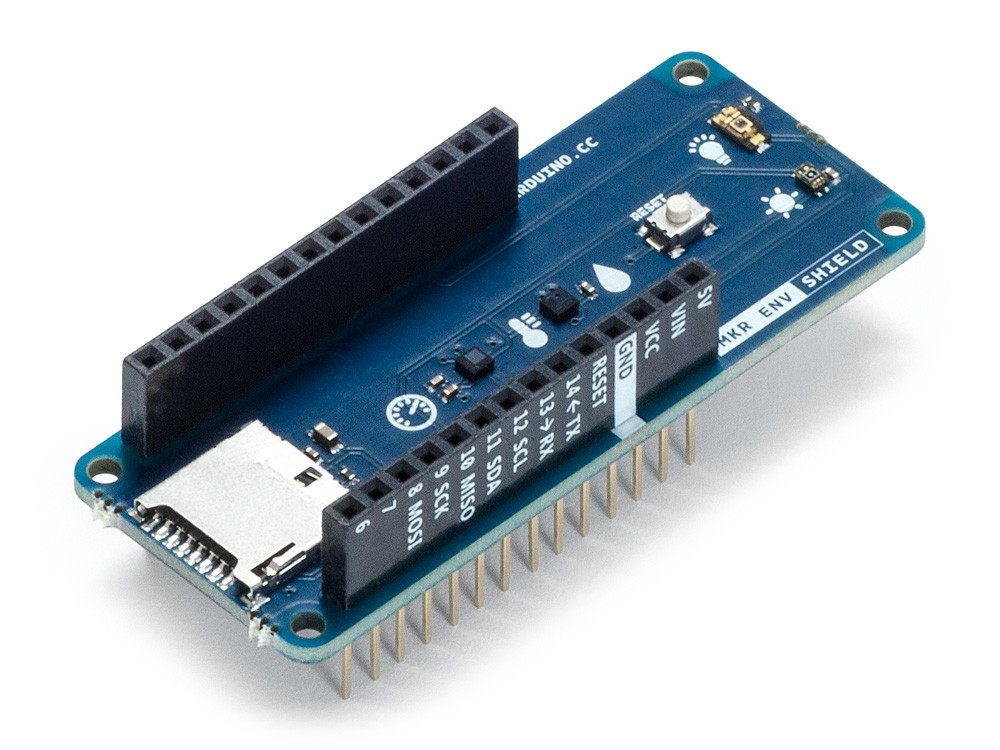
Other key components we will use include the Arduino MKR ENV shield and the Arduino MKR RGB Shield.
Arduino MKR ENV Shield
Arduino MKR ENV shield allows the MKR Arduino board series to acquire environmental data via a plethora of inbuilt sensors including;
The Arduino MKR RGB, on the other hand, is made up of an array of super bright LEDs which, with the use of a superb library, allows the display of static and scrolling text in minutes. It will be used to display a text corresponding to the state of the on/off button on the Adafruit IO dashboard.
Arduino MKR RGB Shield
At the end of this tutorial, you would know how to build IoT devices that are based on the Adafruit IoT cloud and for those who may be new to the MKR series of boards, you would know, developing basic and complex projects based on them.
Required Components
The following components are required to build both parts of this tutorial;
All of these components can be bought from the Arduino store or from electronics components sales platforms like Seeed Studio, and Aliexpress.
Schematics
As mentioned during the introduction, there are two parts to this tutorial as such, we will have two schematics.
Schematic 1: Sending data to the cloud
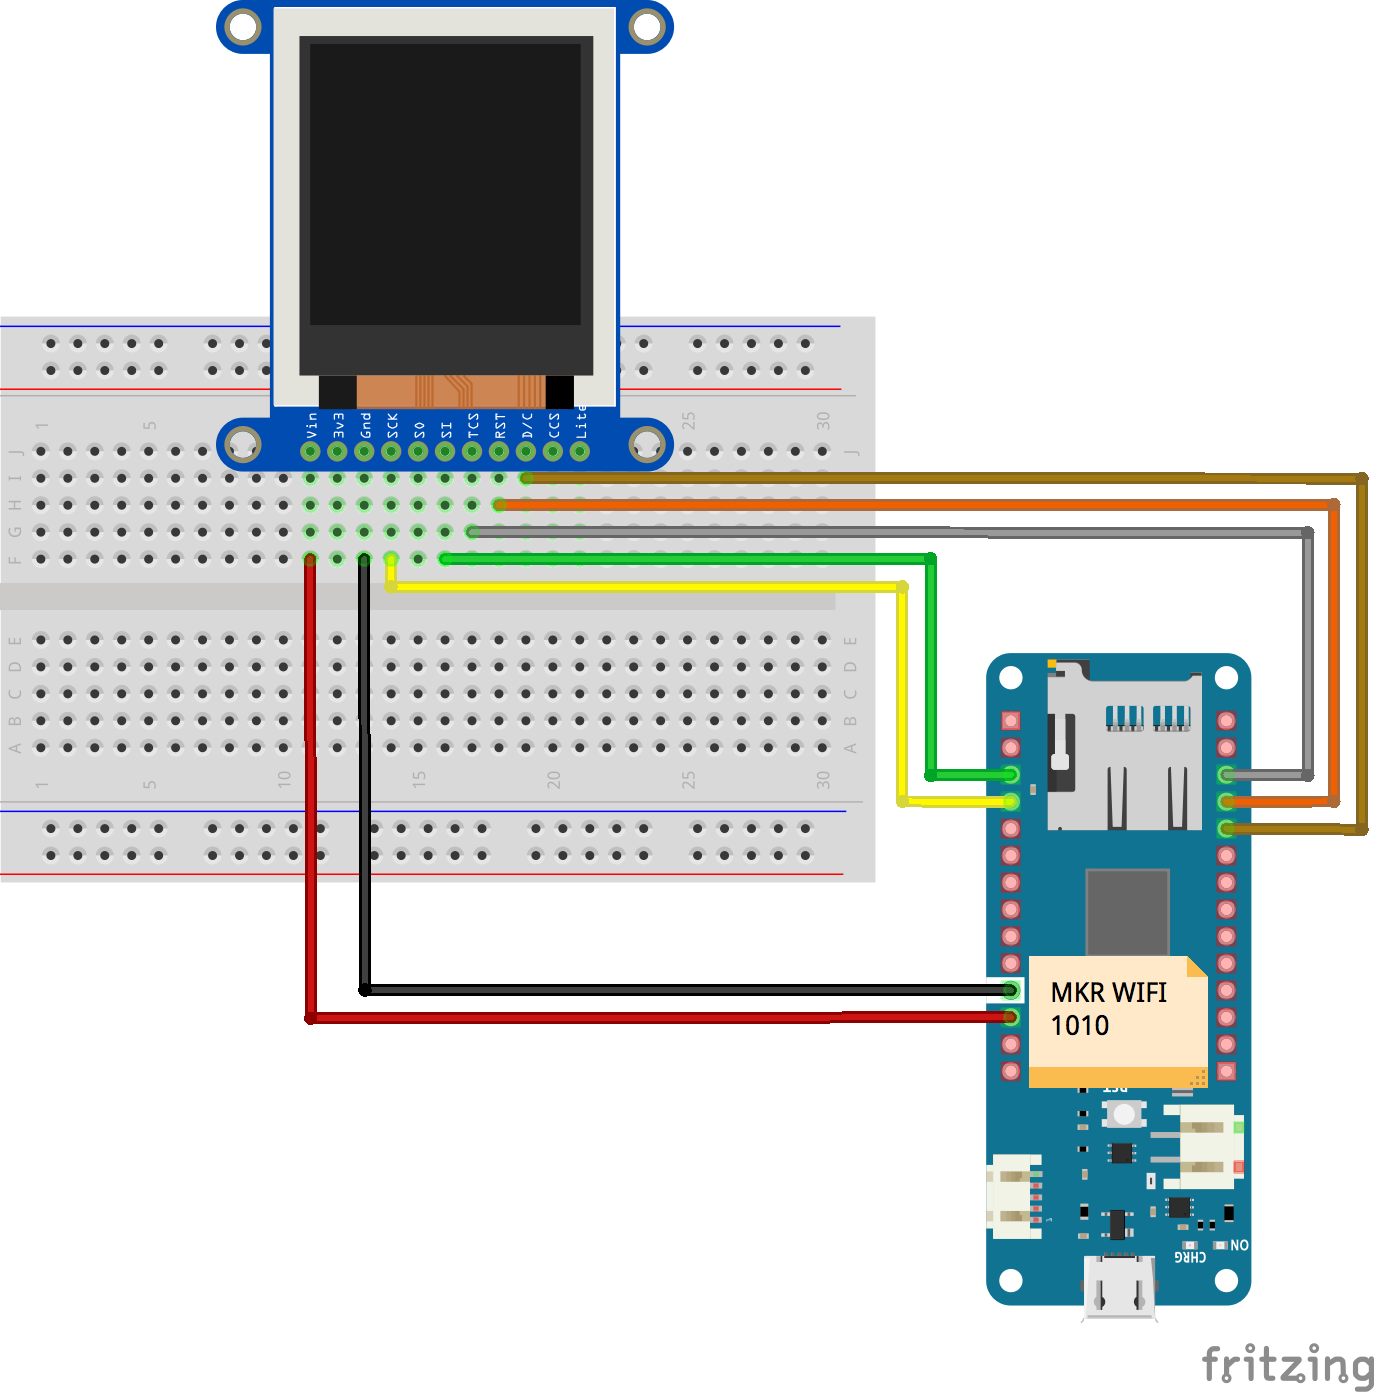
For the first part, we will use the Arduino MKR WiFi 1010 board, the MKR ENV Shield, and the 1.44″ TFT Display. The MKR ENV Shield, like the name implies, comes as a shield and is plugged on top the MKR WiFi 1010, leaving us with just the connections between the MKR WiFi 1010 and the 1.44″ TFT display. Connect as shown in the fritzing schematics below.
Schematics
To make connections easier to follow, the pin to pin map of the connection between the MKR WiFi 1010 and the 1.44″ TFT is shown below.
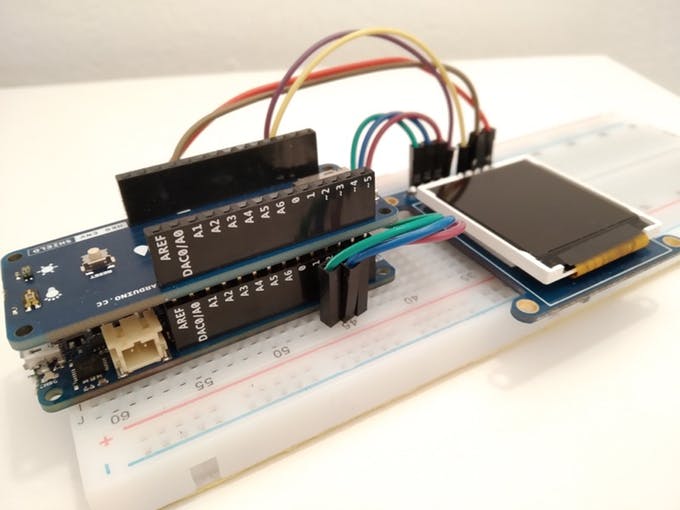
After connecting the components, your setup should look like the one in the image below.
Part 1 Components Assembly
Schematic 2: Receiving Data from the Cloud
For the second half of the project (Receiving Data from the cloud), we will use Arduino MKR WiFi 1010 and the Arduino MKR RGB Shield. While adjustments could be made to accommodate the sensors on the ENV shield, we will do it this way to keep things short and simple.
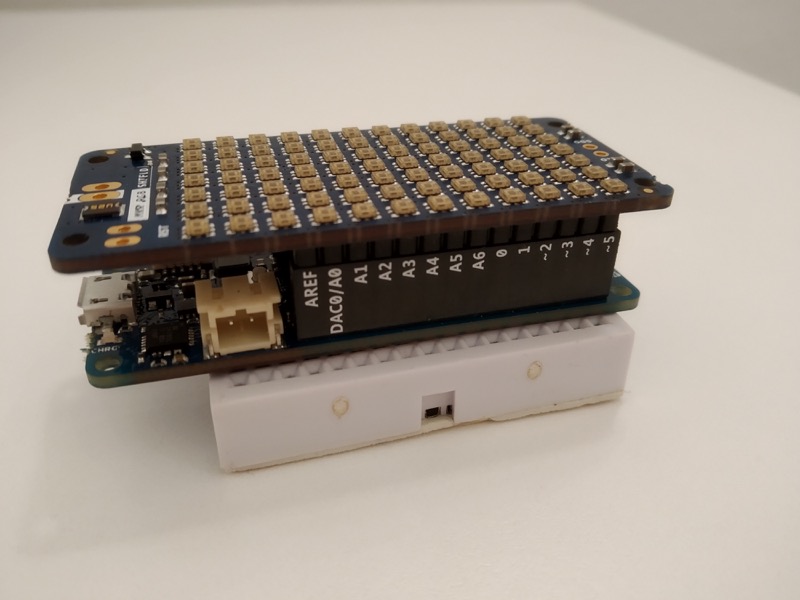
Just like the MKR ENV Shield, the RGB Shield also comes as a shield and should be plugged on the MKR WiFi 1010 as shown in the image below.
Part 2 Connection
Since you will most likely use the same MKR WiFi 1010 for both parts, you can complete the code upload of one part before connecting the second part.
Programming
Just like we did under the schematics, we will also split this into two parts. The first part will be for programming the board to send the data as we highlighted initially, and the second part will be to receive data from the IoT Cloud and display on the RGB shield. For both parts, we will use the WIFINNA library and the Adafruit IO Rest API. You could also choose to use the Adafruit IO library.
Part 1: Sending data to the Cloud
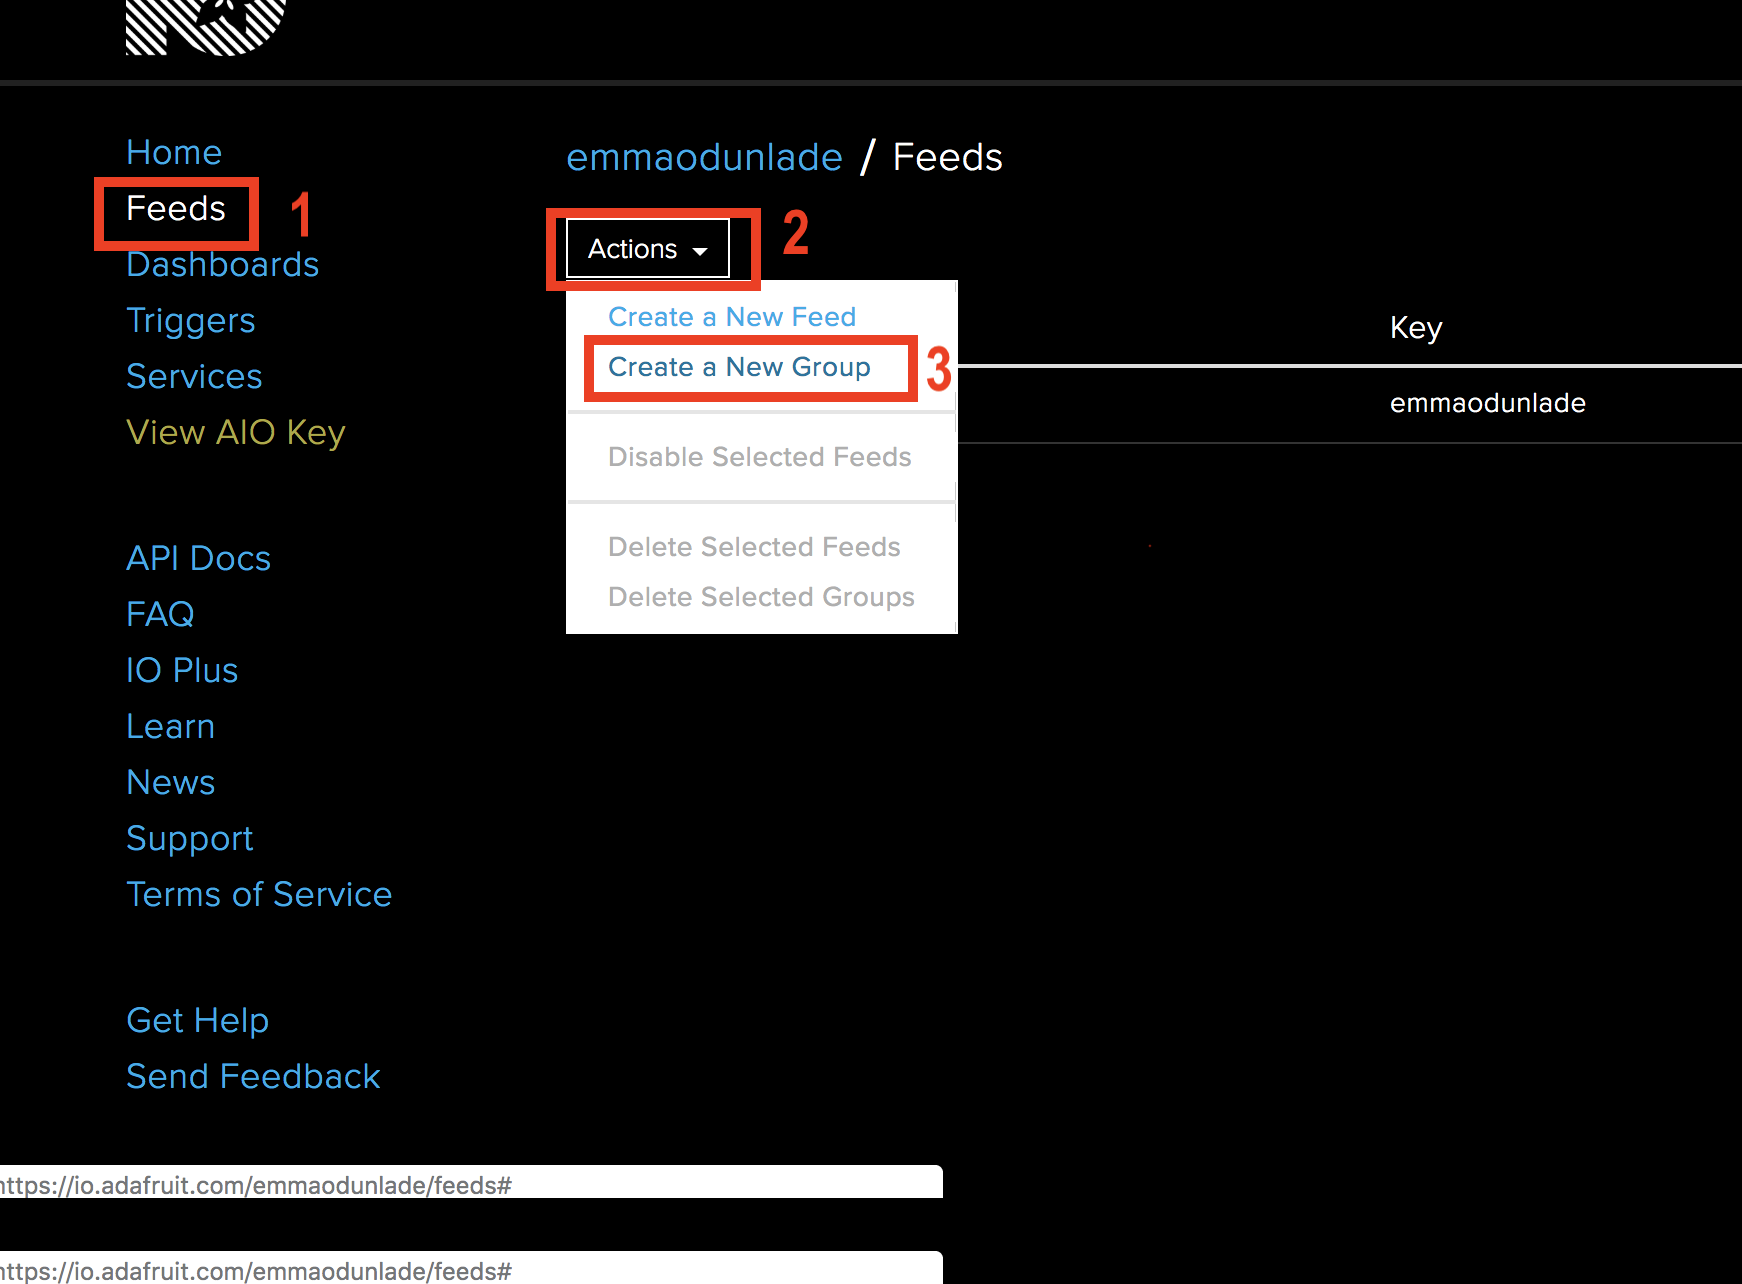
Before we start writing the code, we need to create the “feeds” on Adafruit.io to which the data will be reported. The feeds will be placed in a group to make it easy for us to manage and send data with a single command. Follow the steps below to do this;
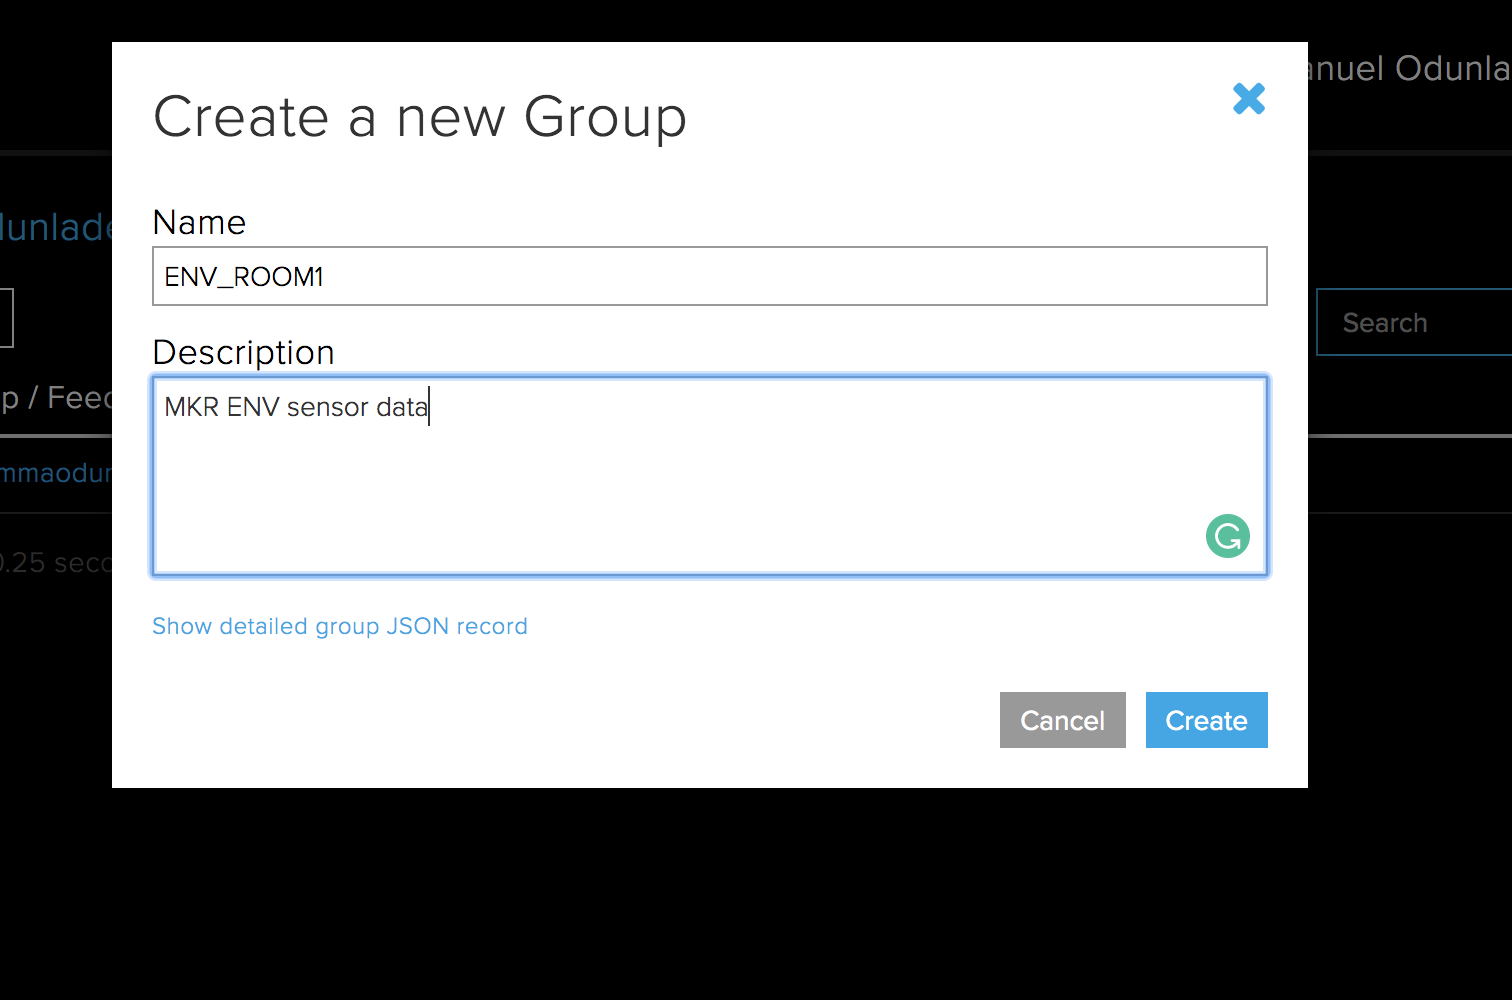
-Logging in should take you to the Adafruit IO home page. Click the feeds button, it should take you to a page with a list of all the feeds that have been created on your account. Click on the “actions” button and select “create a new group” from the dropdown menu.
-Enter the name of the group and a description and click the create button.
Create a group to house all feeds
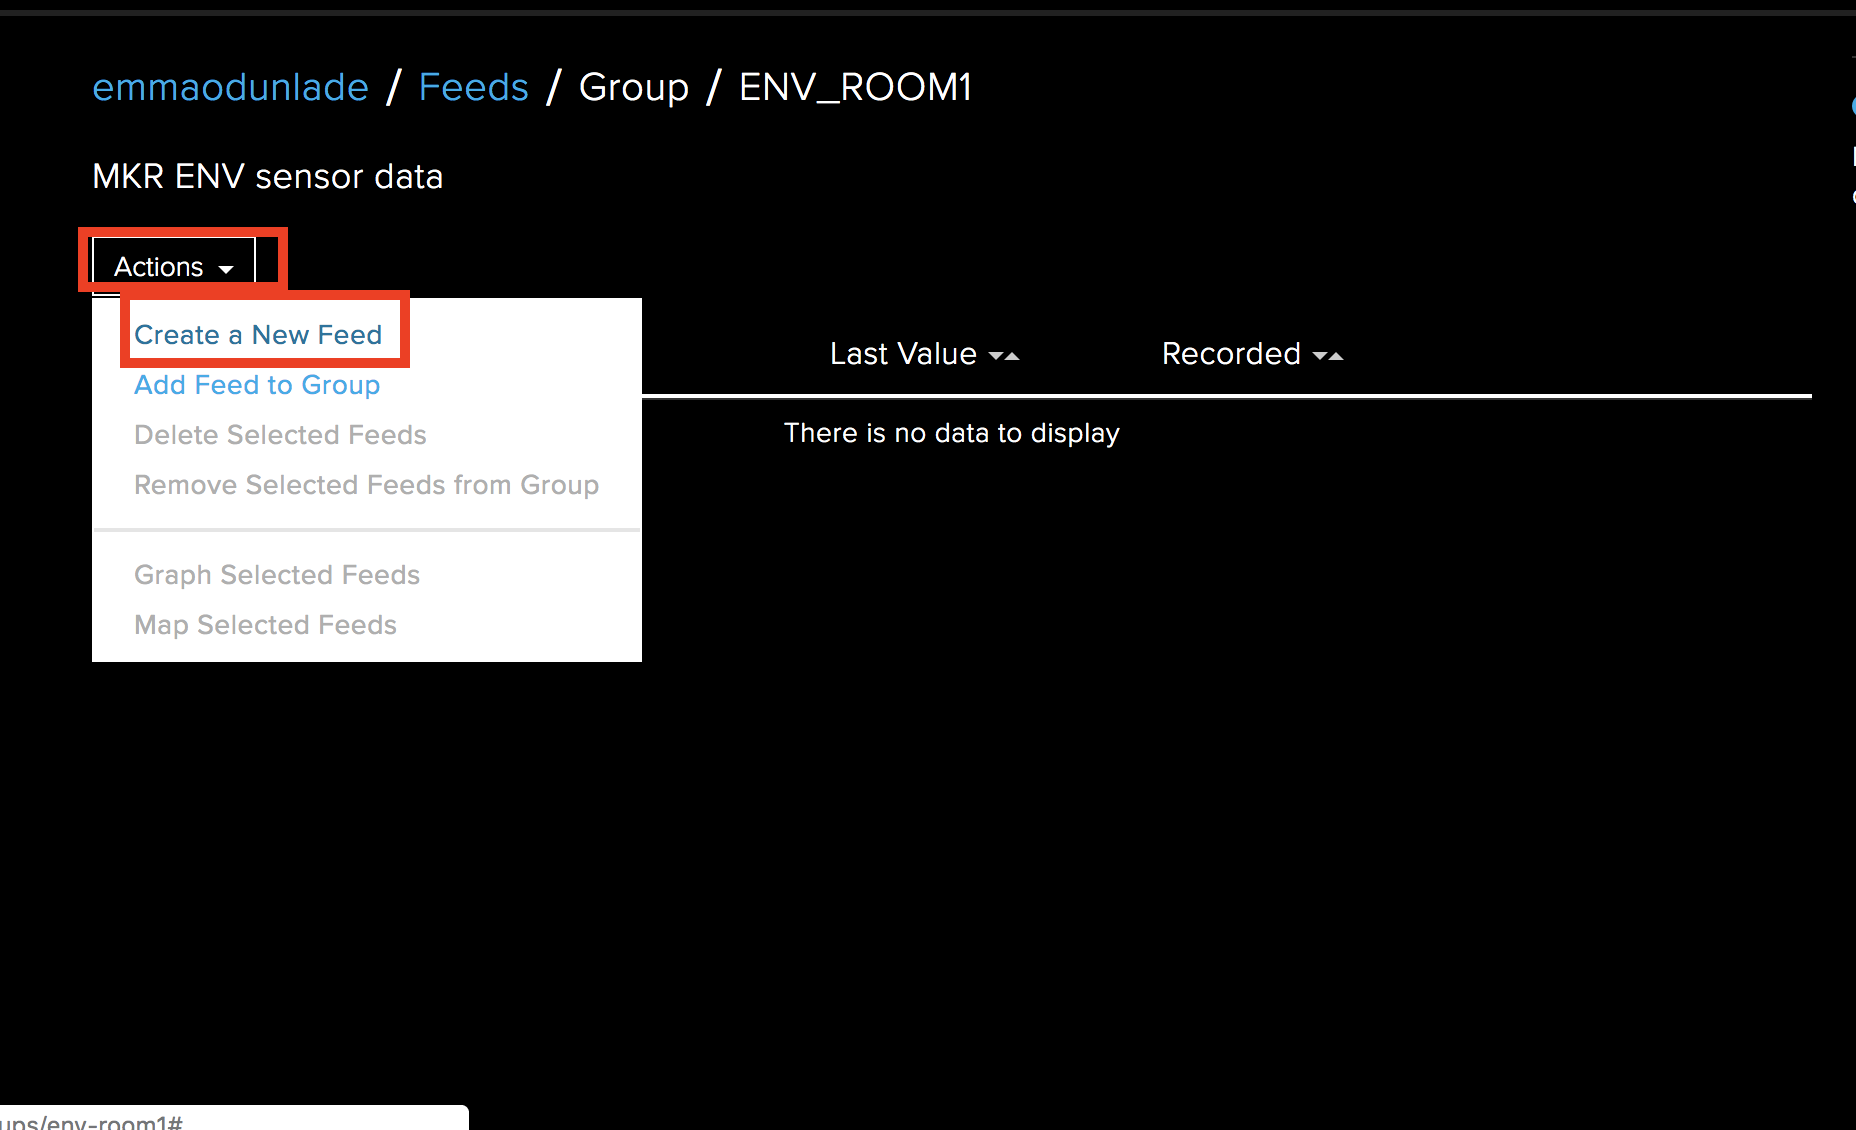
-With the group created, we need to add four feeds under it, each one for the parameters we will monitor. Click on the group you just created, when the new page opens, click on the action button again and select “Create a new feed“.
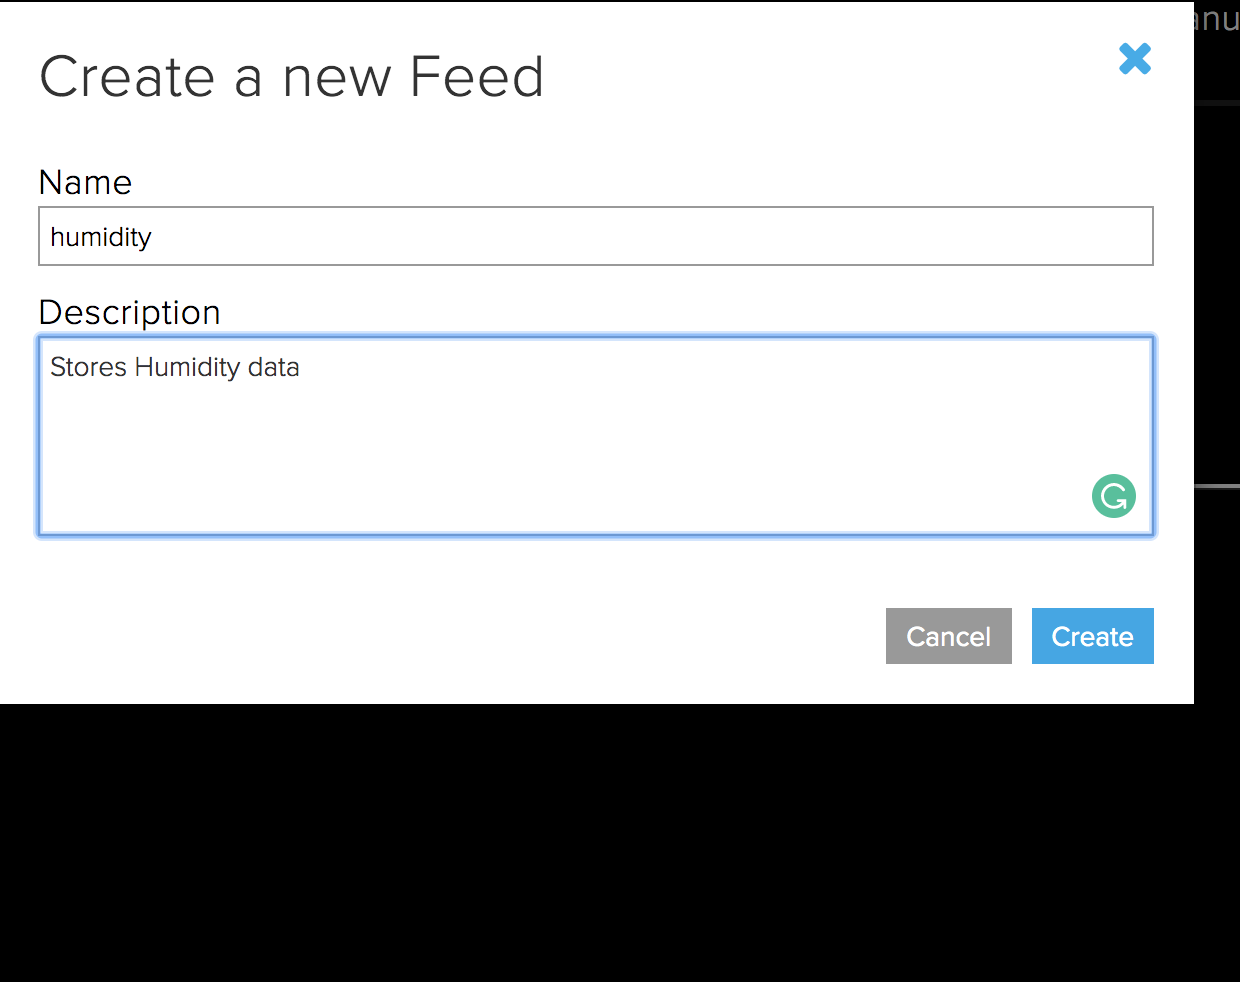
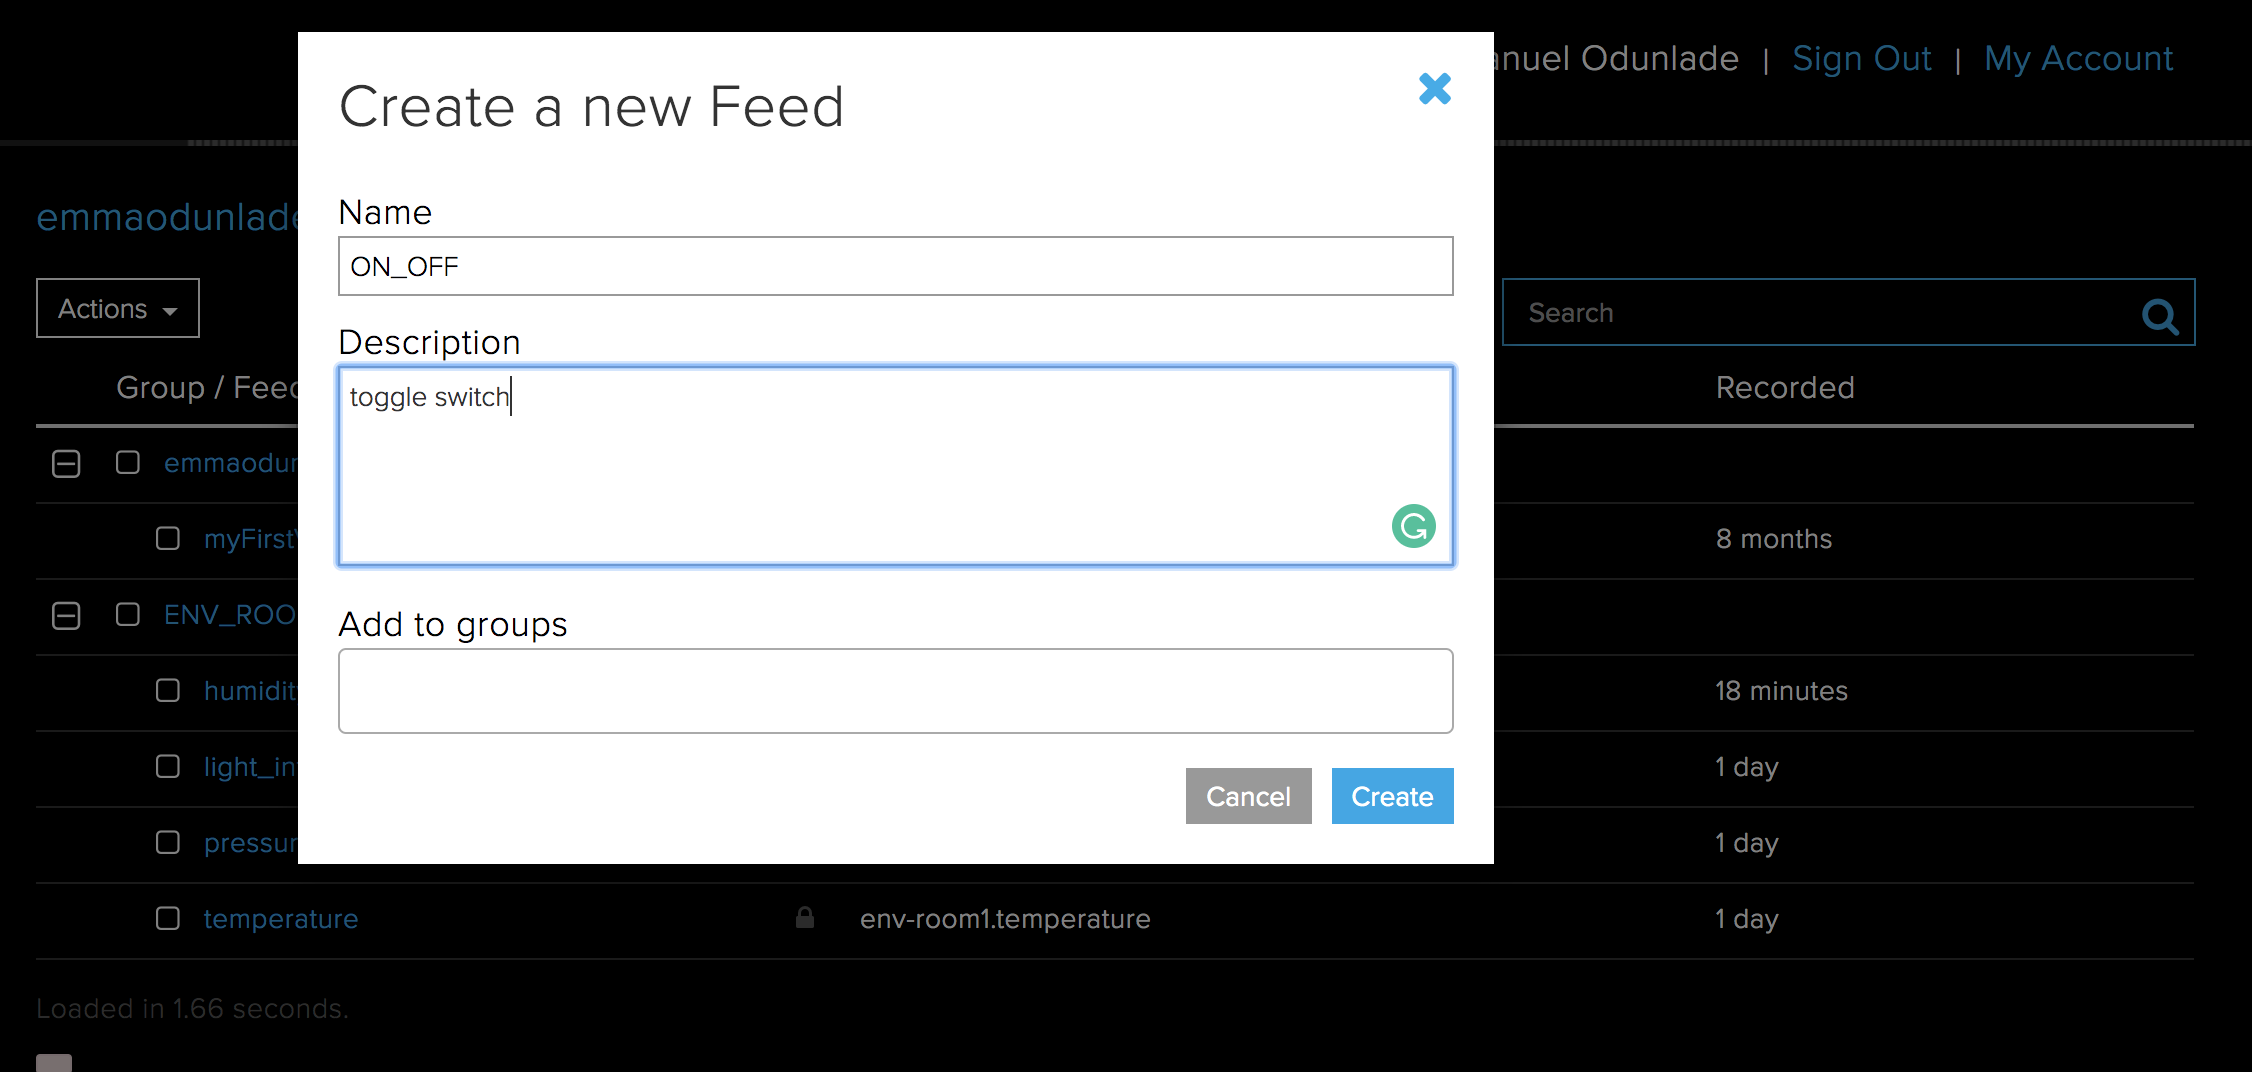
-In the dialogue box that opens, enter the name of the feed, and a description then click the create button.
Creating a New Feed
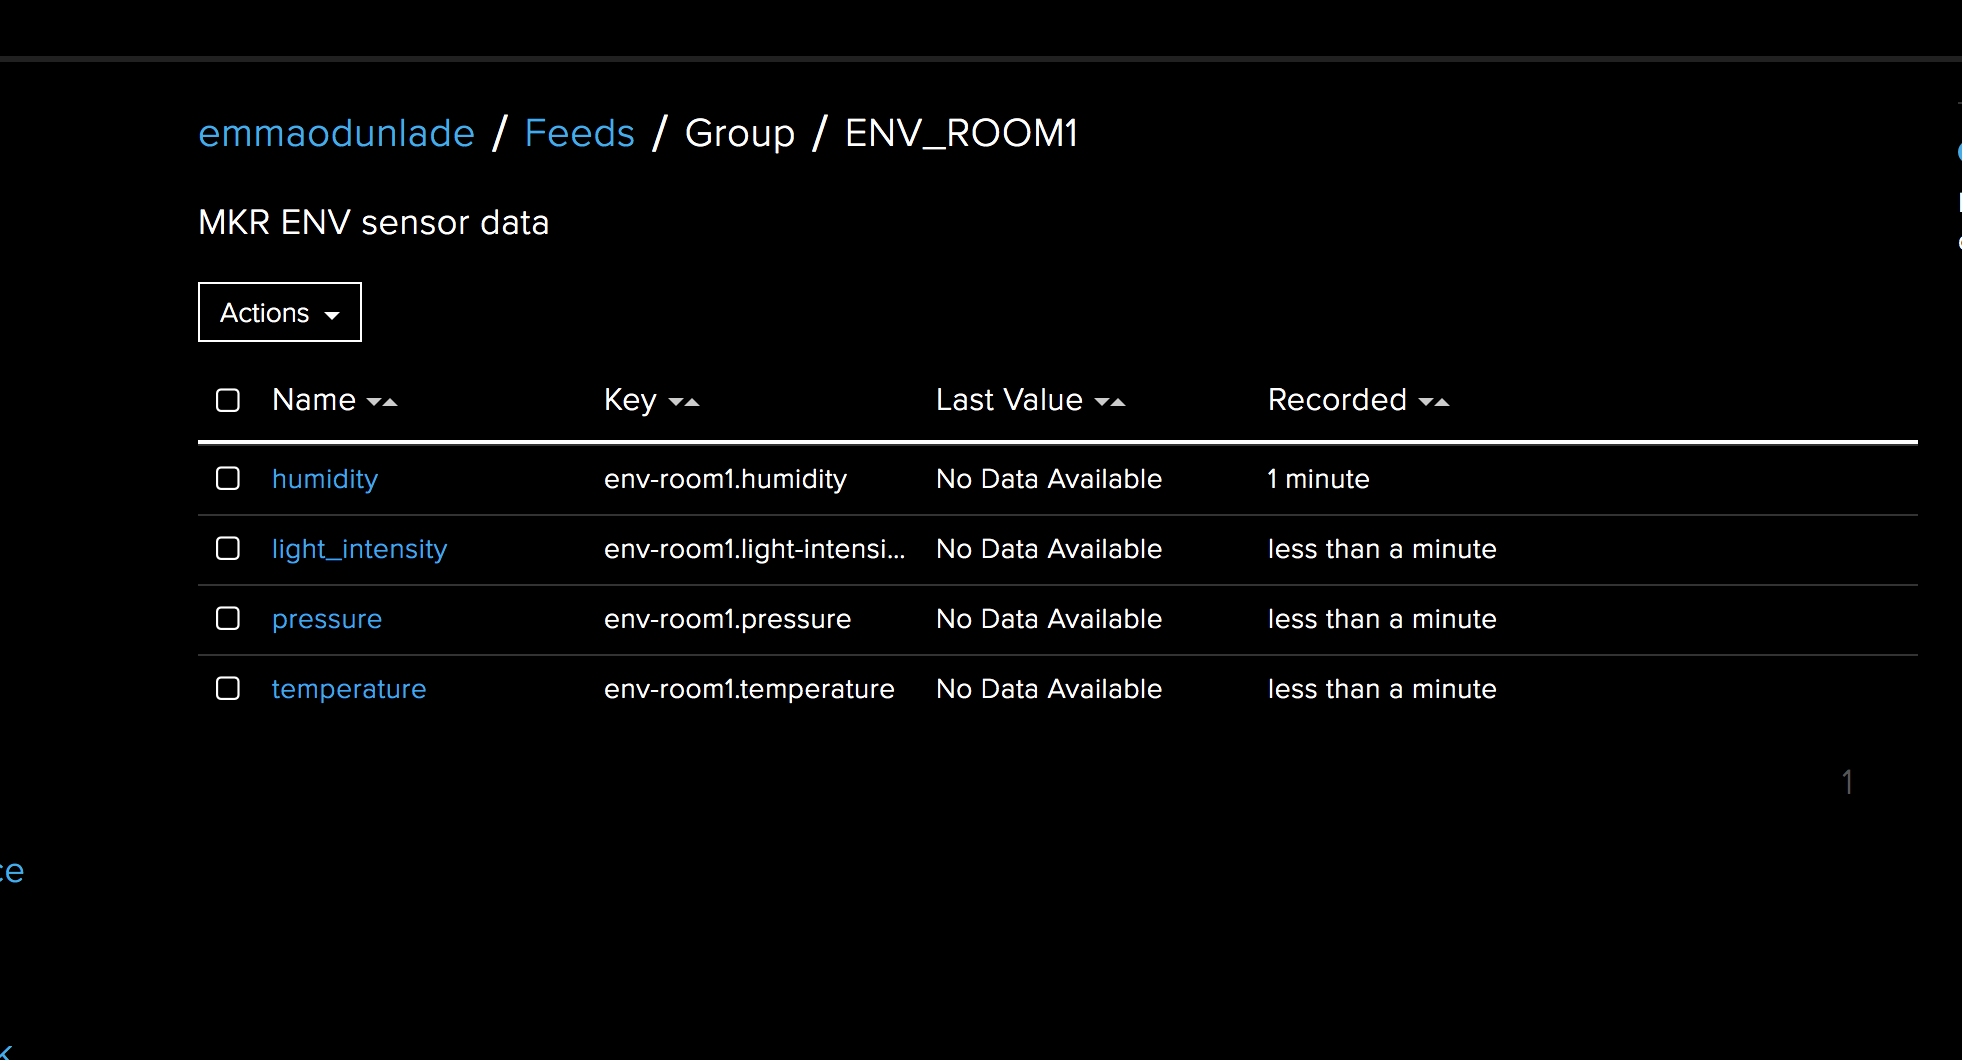
-Repeat step 4 and 5 for all the other parameters; temperature, humidity, Light Intensity, and pressure. When done, the group feed should look at the image below.
All Feeds Created
By clicking on each of the feeds and scrolling down, a history of data stored in the feed can be seen, however, to make it more interactive and user-friendly, we will create a dashboard to host the data from all the four feeds. To do this, follow the steps below.
-Click on the dashboard button just below feeds on the right-hand side of the IO page, just below feeds.
-It will open a list of all the dashboards you have created. If you have less than four(the free access to Adafruit IO allows just four dashboards), click on the action button at the top of the page and select “create a new dashboard“.
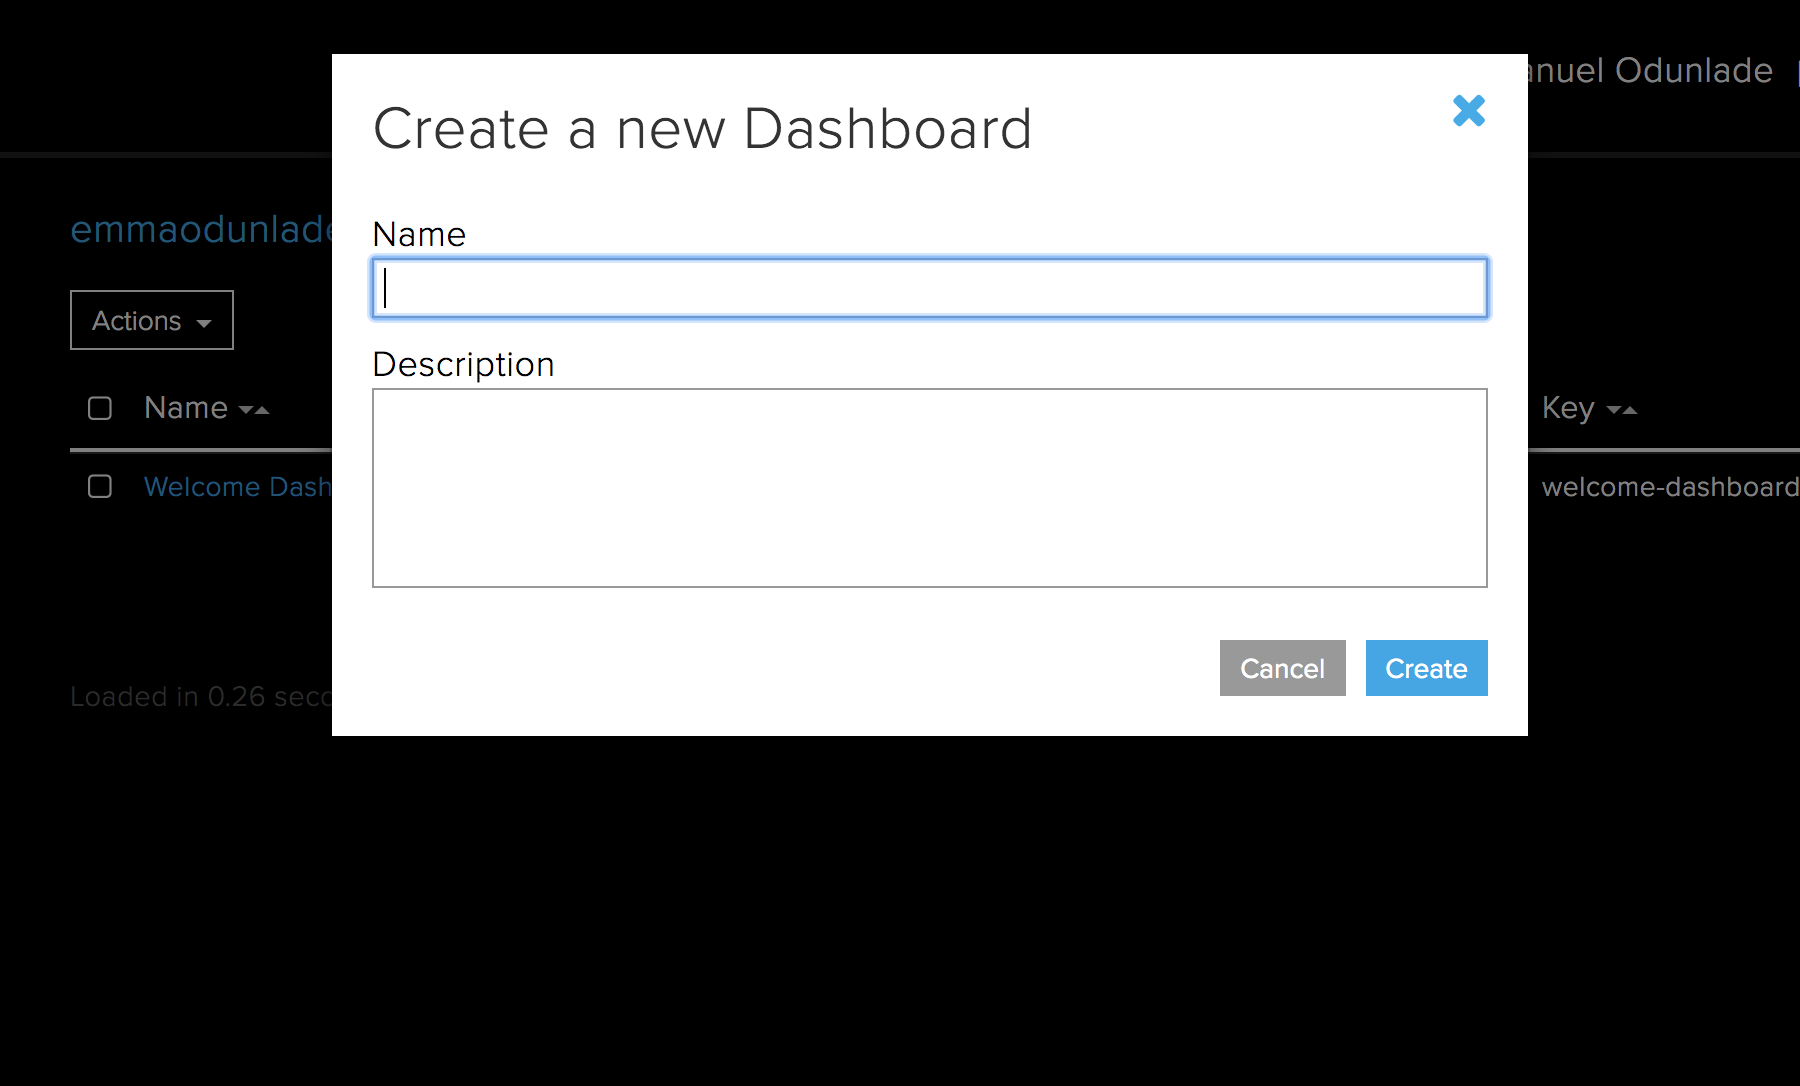
-Enter the name and description of the dashboard in the dialogue box that opens and click the “create” button.
Create a New Dashboard
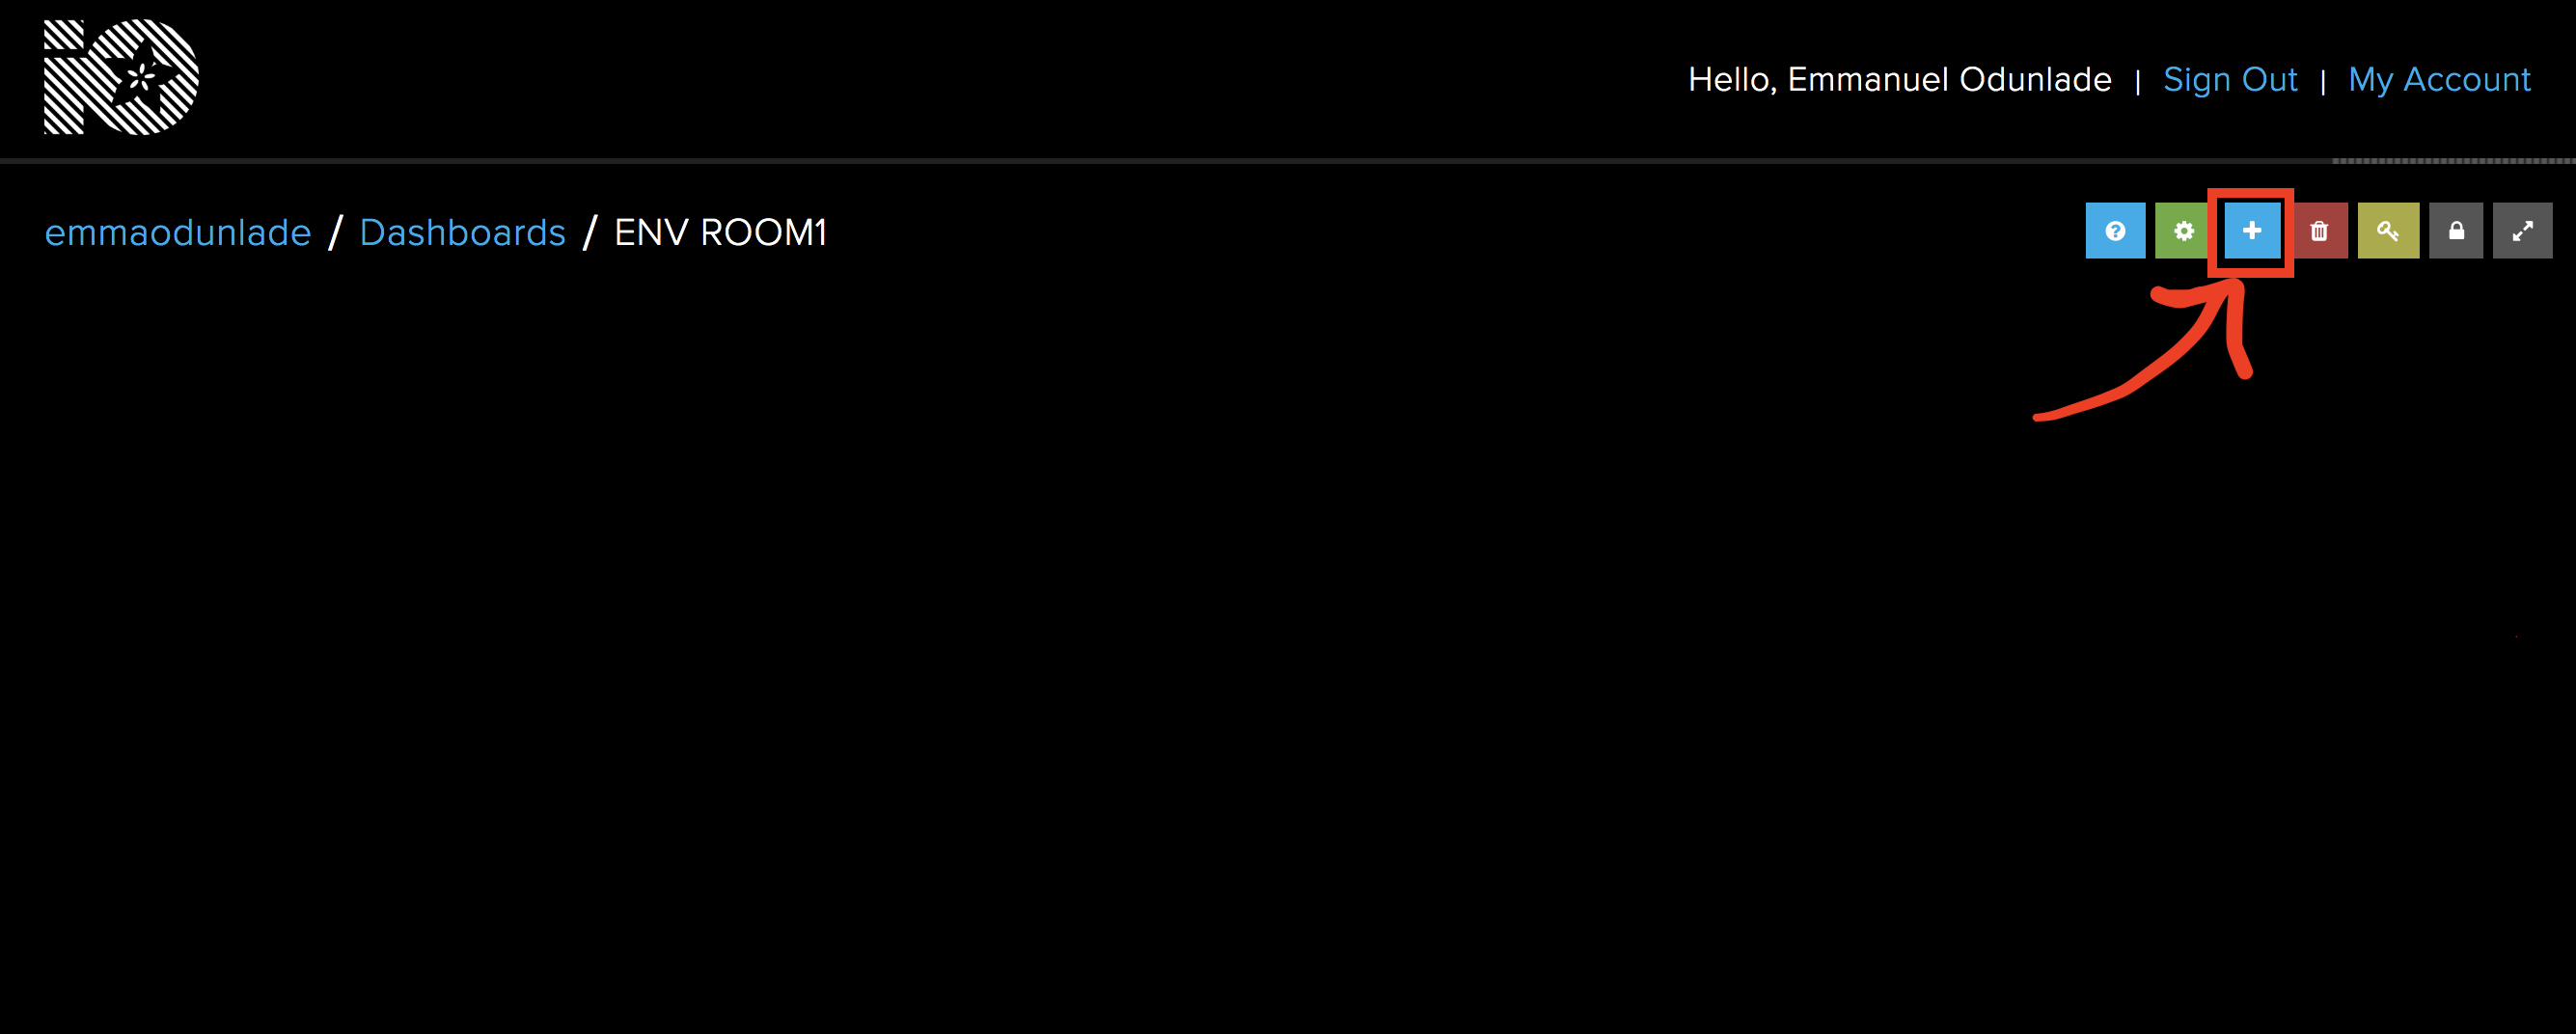
-Click on the dashboard you have created, it should open a new window. On the window, click on the “+” Icon to start adding blocks (widgets) to the dashboard.
Add Blocks to Dashboard
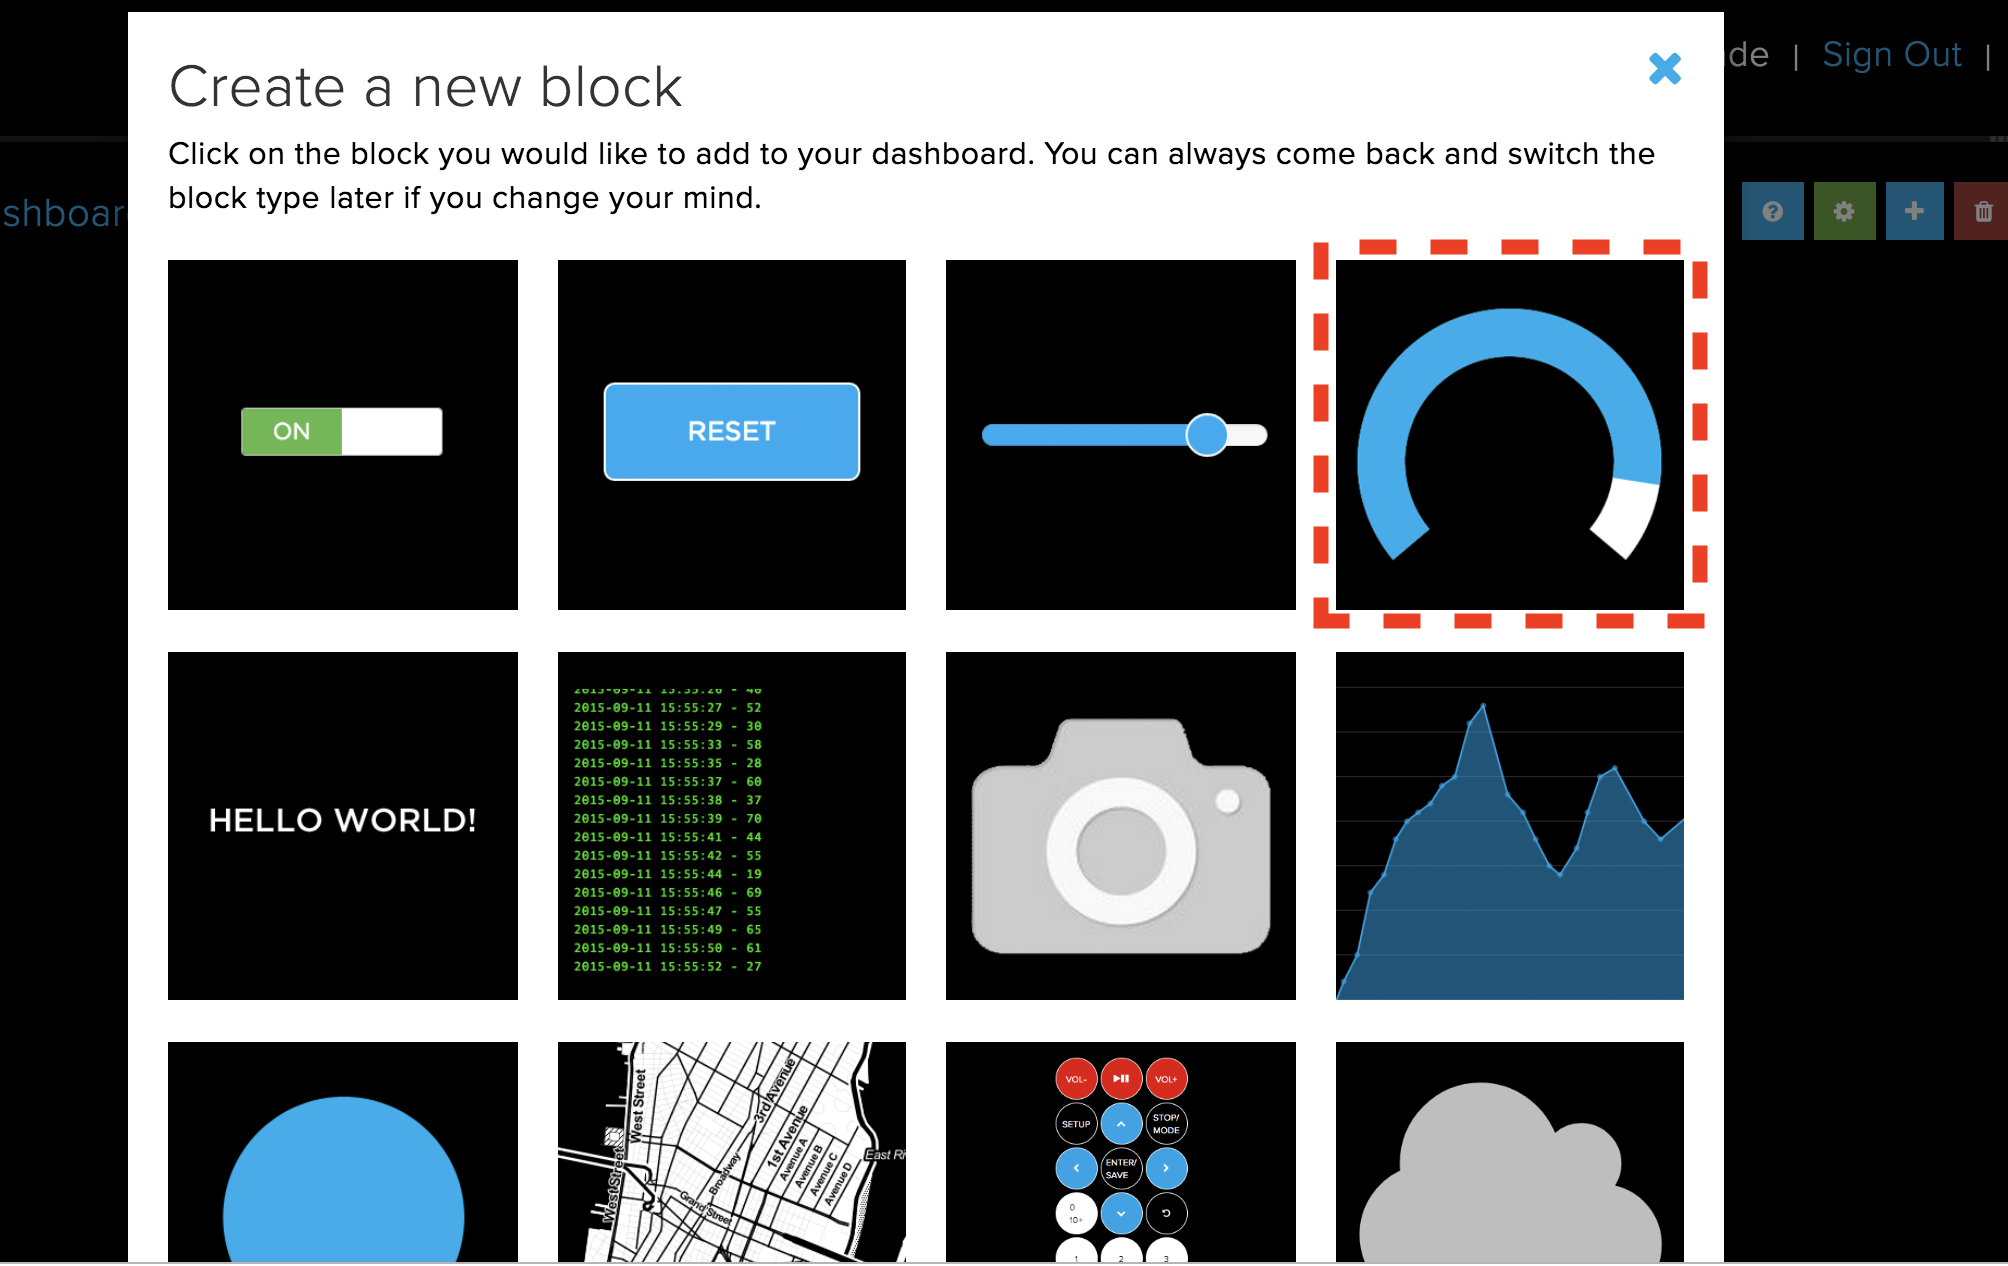
-For this tutorial, we will use a gauge widget to represent each of the parameters to be monitored. Click on the Gauge block.
Select the Gauge Widget/Block
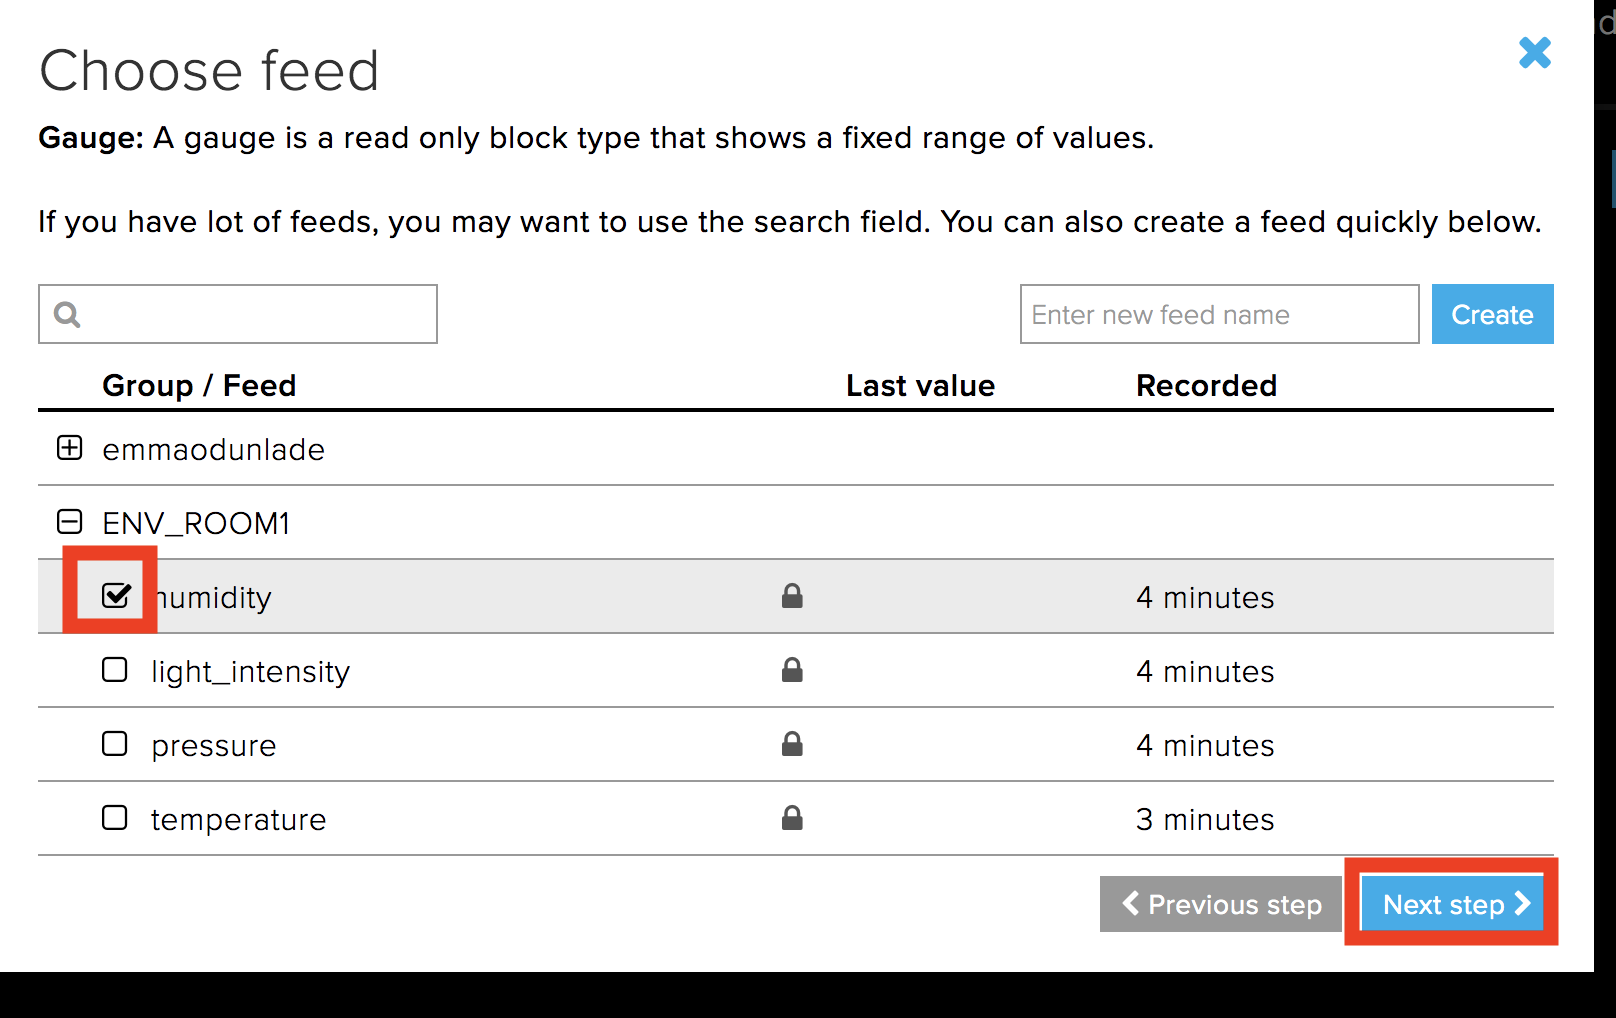
-Clicking on the gauge block will open a dialogue block to enable you to set the properties of the block. Select the feed to whose data will be displayed on that block and hit the next button.
Select Widget Feed
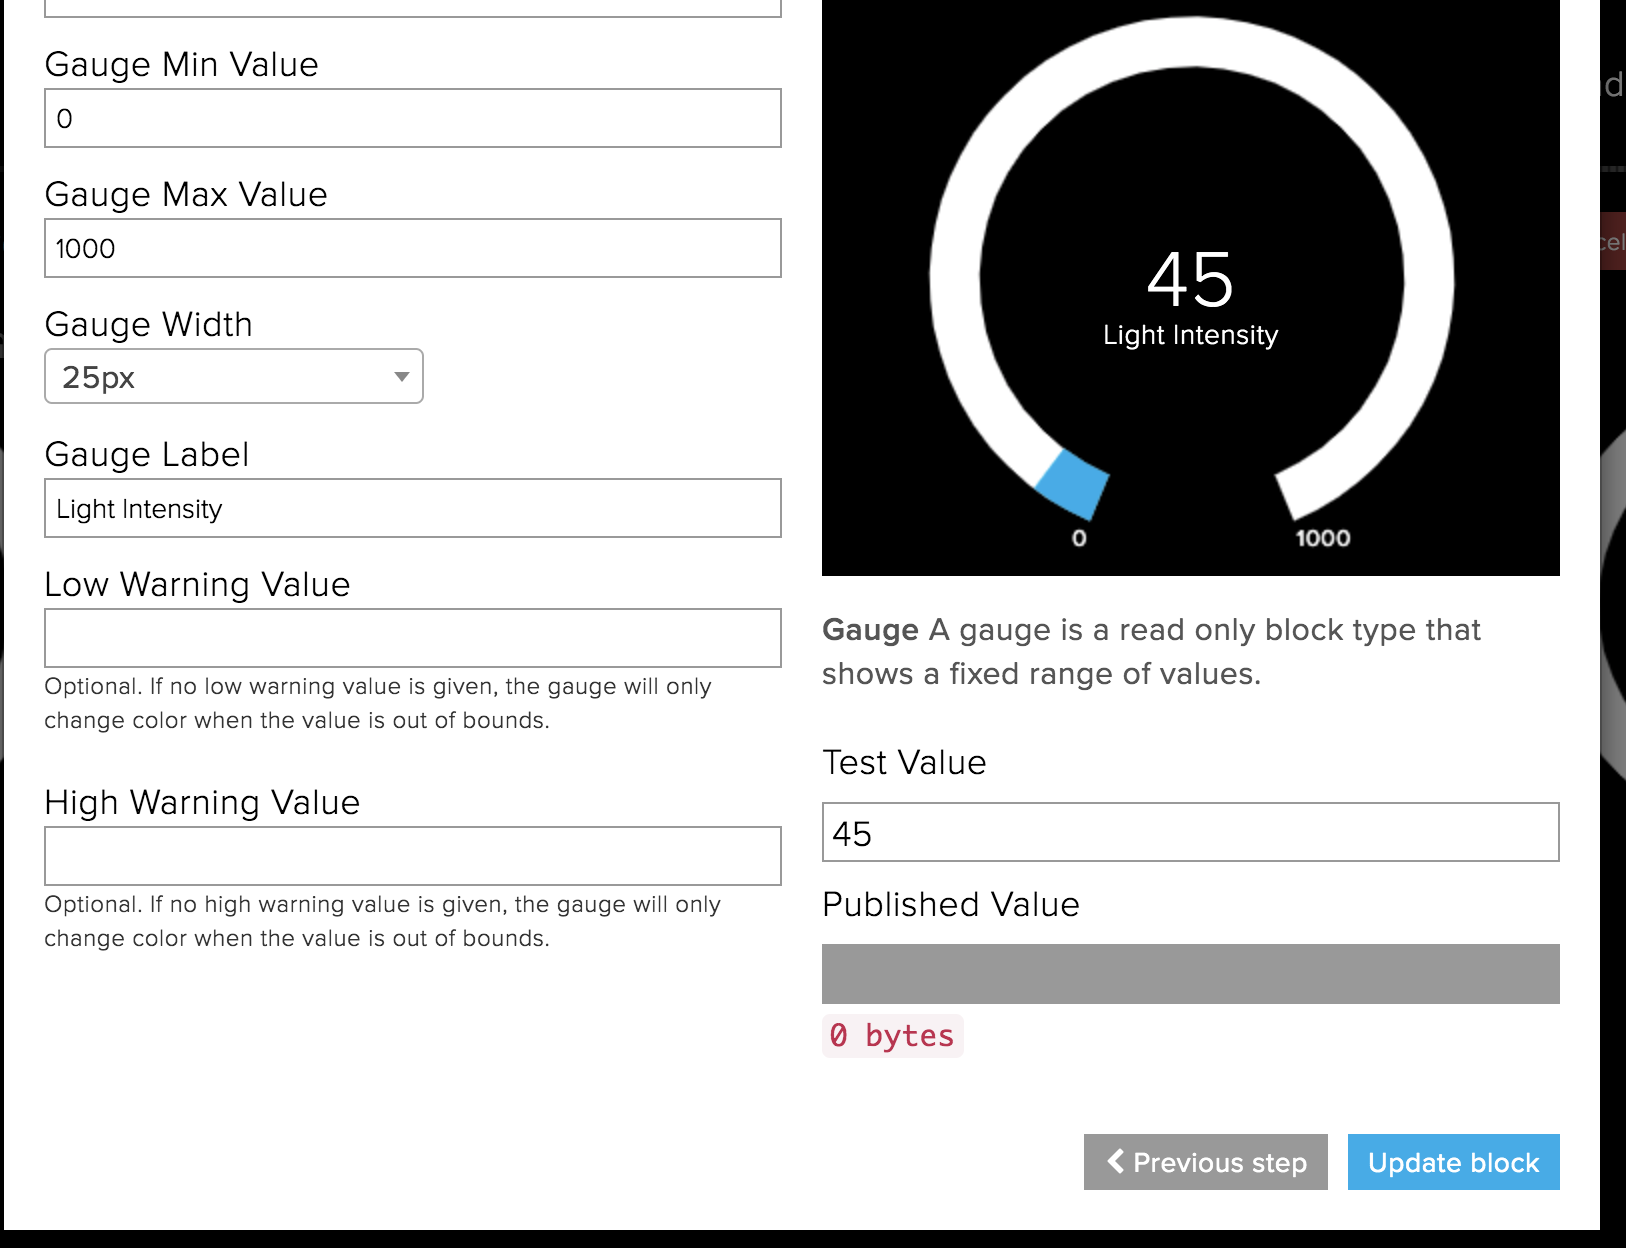
-On the next page, Enter the label you want to be displayed on the gauge (best if its the same name as the field for easy referencing), set the min and max values as desired, then hit the create block button.
Set Widget parameters
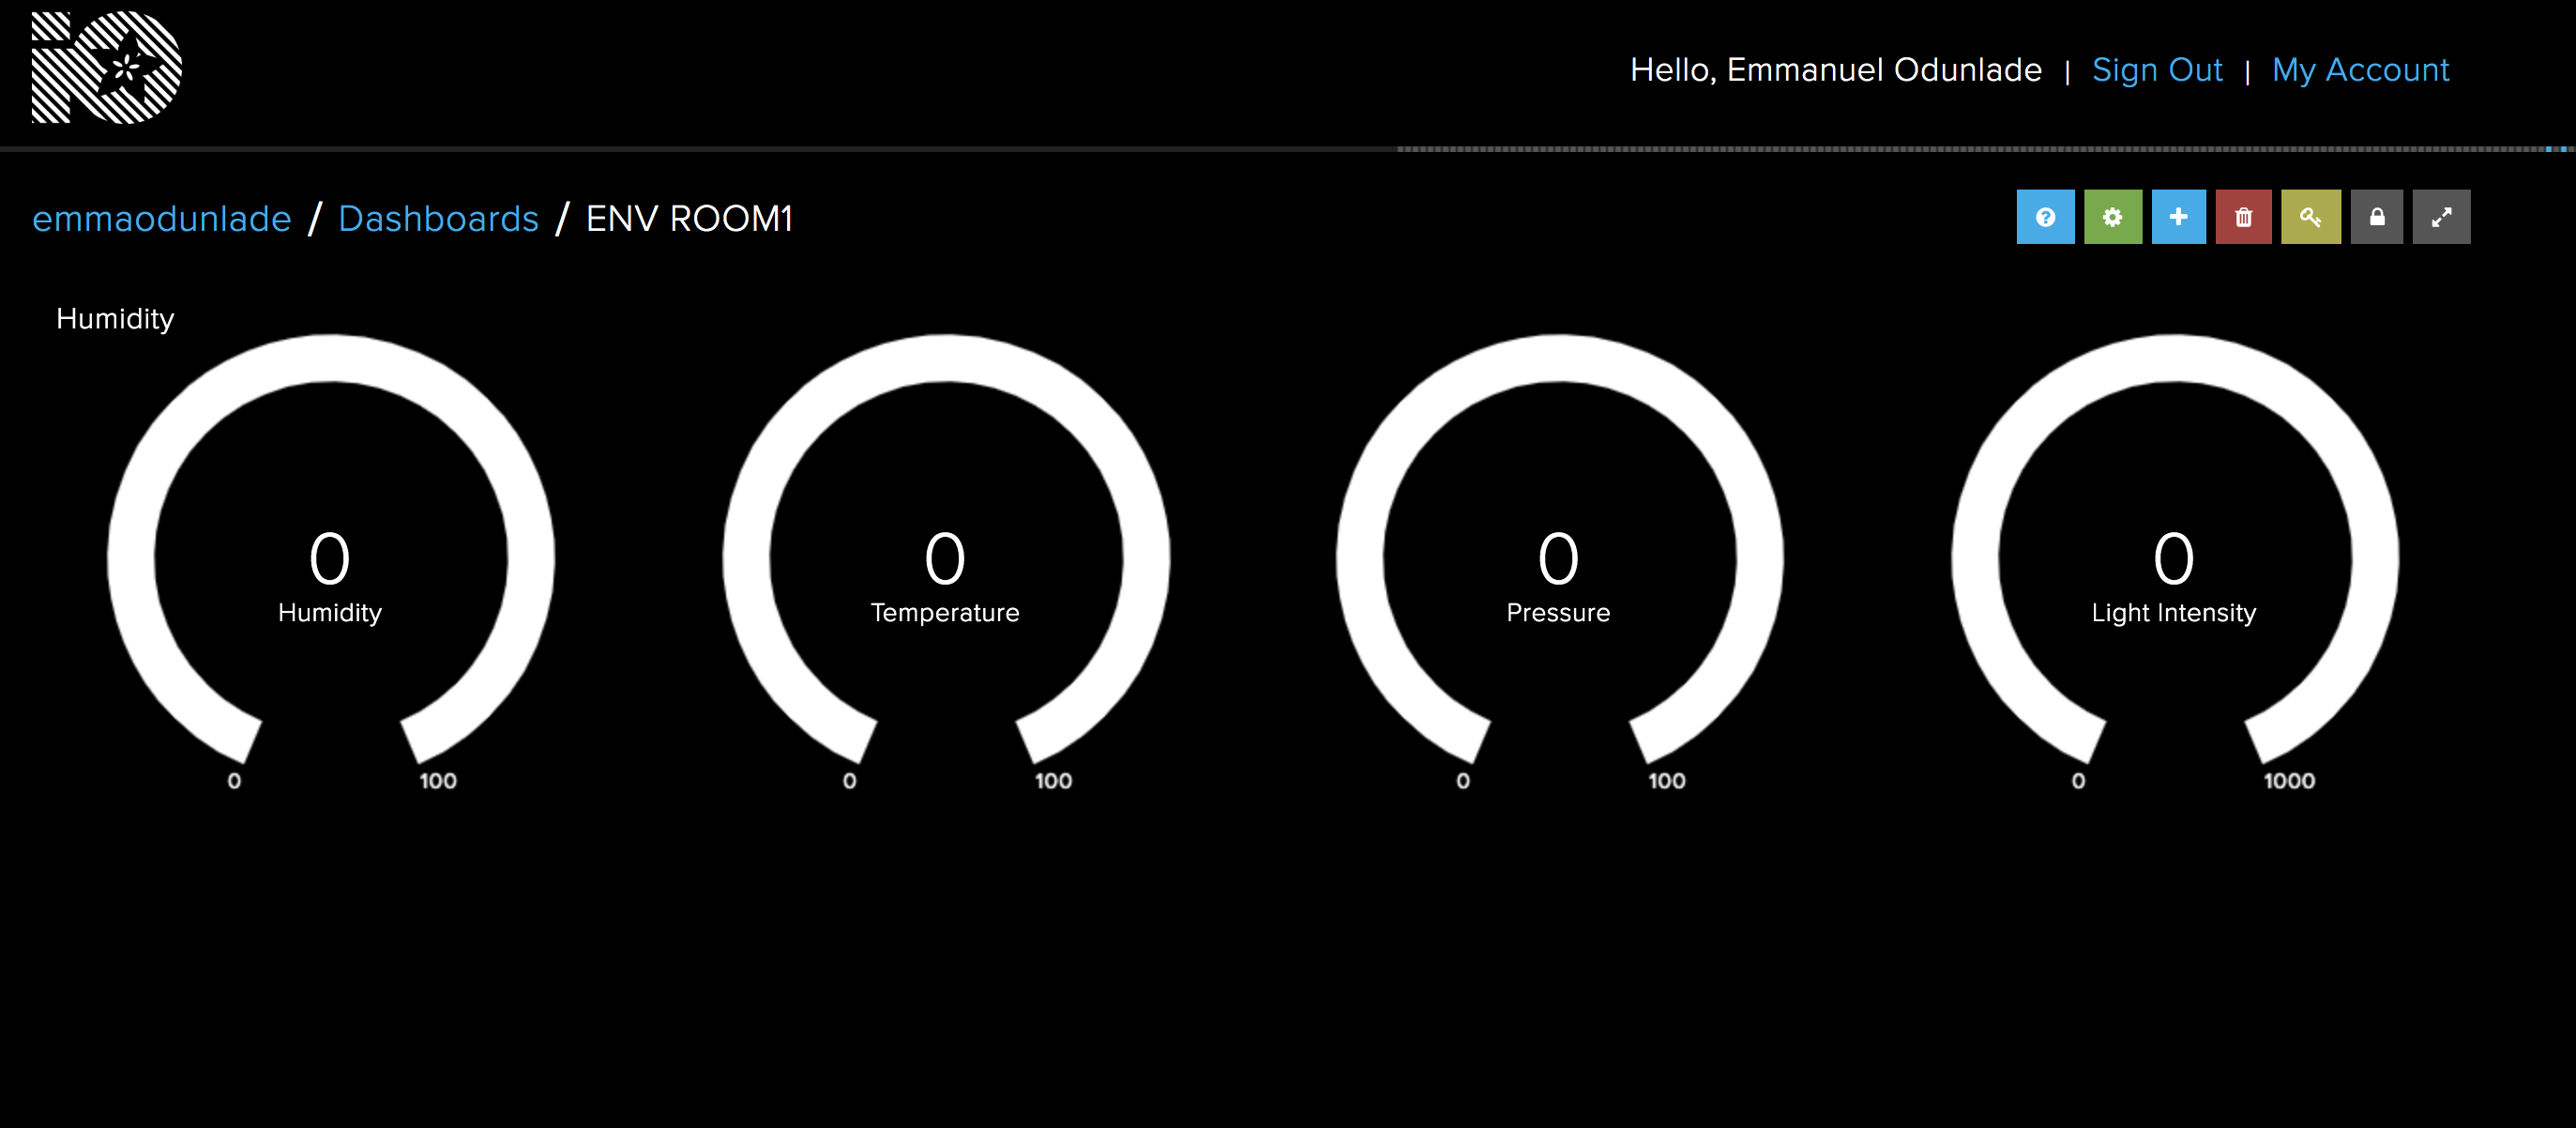
-Repeat step 4 – 7 for the remaining feeds. Your Dashboard when done should look like the one in the image below. The blocks can be rearranged by clicking the settings icon and dragging the blocks until they are side by side. Since no data has been uploaded to it yet, all values will be at zero.
Dashboard Preview
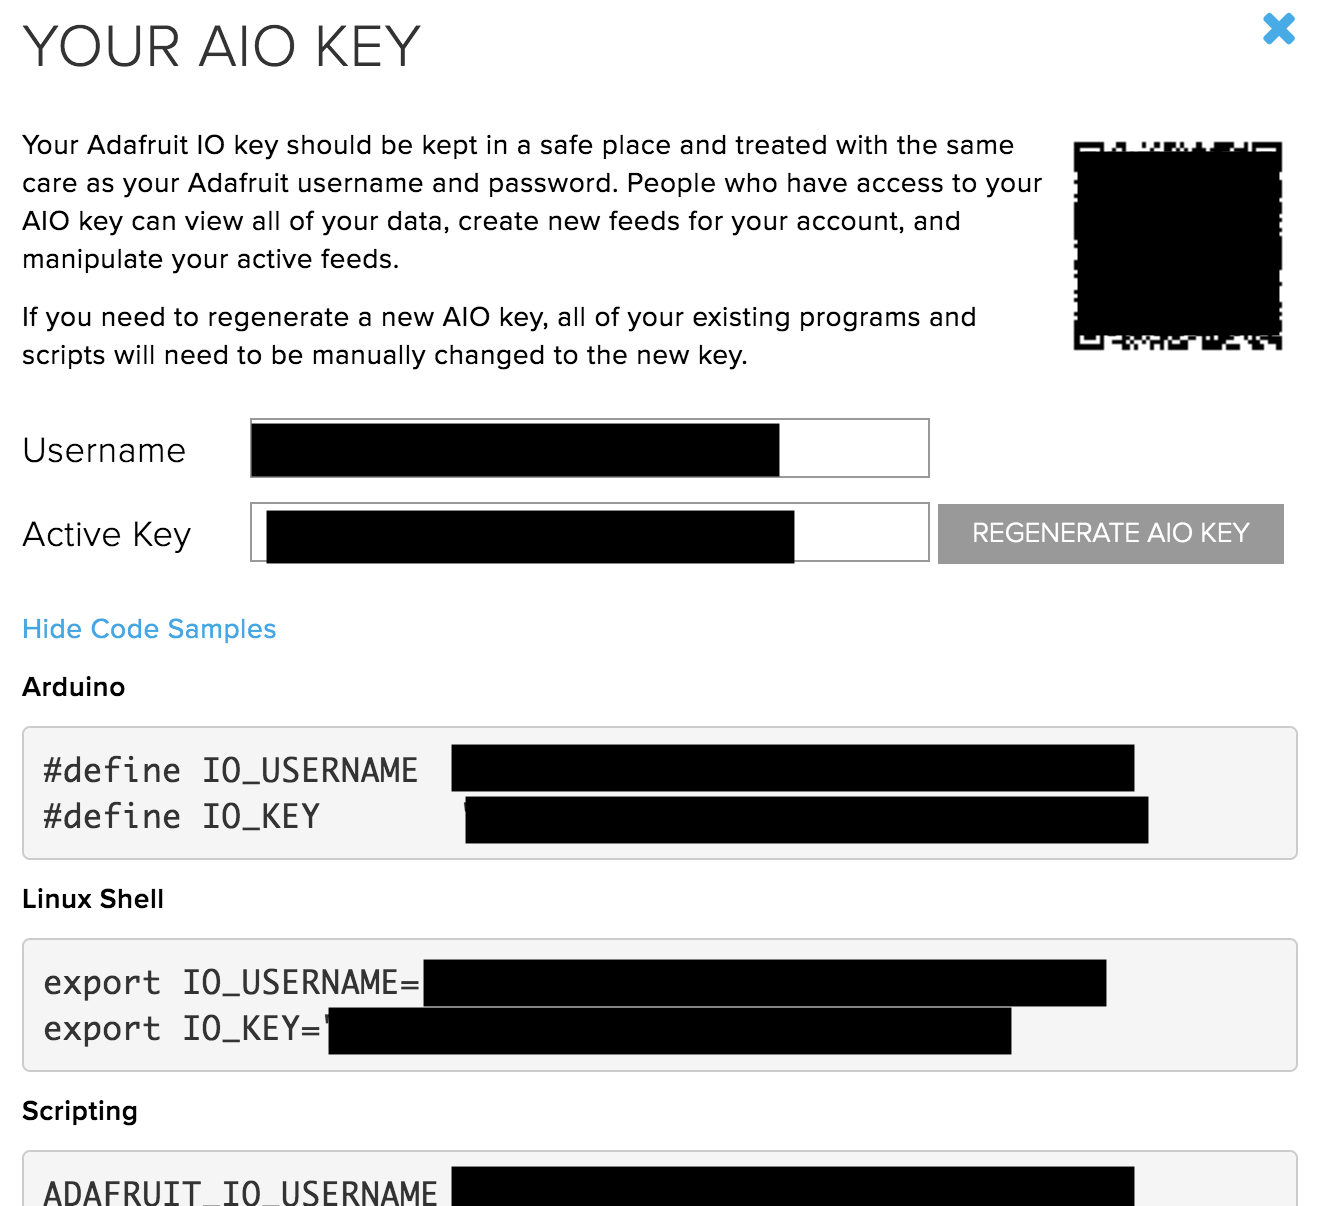
With that done, we proceed to obtain the last element of the Adafruit IO that will be used in our code; the AIO key. The AIO key is an alphanumeric key that allows secure communication between your device and Adafruit IO. Go to your IO home page, just below services after dashboard you will see the view AIO key button. Click on it to open a page similar to the image below. Copy the AIO key for later use.
Get AIO Key
With this done, we are now ready for the code.
As mentioned earlier, we will use the WIFININA library along with the Adafruit IO Rest API but for this part, in addition to those libraries, we will also use the Arduino JSON library, the Adafruit GFX library,the Adafruit ST7735 library, and the MKR ENV library. The Arduino JSON library will be used to group the data when sending to Adafruit IO, while the ST7735 library facilitates communication with the 1.4″ TFT display, and the GFX library makes it easy to display graphics and the text on the TFT. The MKR ENV reduces the amount of code needed to obtain data from the ENV shield.
As usual, I will do a quick run through the code to explain the concepts involved.
We start the code by including all the libraries that we will use. To make the code modular and clean, a header file (called arduino_secrets.h) was created (in the same folder as the sketch) to store passwords and sensitive data like the AIO key and wifi credentials, include this too along with other libraries that have been mentioned.
Next, we declare the pins of the Arduino to which the Chip Select (CS), Reset (RST) and DC pins of the TFT LCD are connected (as described under the schematics section) and create an instance of the ST7735 library with the variables mentioned above as arguments.
Next, we create the variables to hold the WiFi credentials, the server address, posting interval and a “last connection time” variable to help determine when the next update to the server is due. We also initialize the WiFi Client Library.
char ssid[] = SECRET_SSID;         // your network SSID (name)
char pass[] = SECRET_PASS;         // your network password (use for WPA, or use as key for WEP)
int status = WL_IDLE_STATUS;
char server[] = "io.adafruit.com"; // name address for Adafruit IOT Cloud

unsigned long lastConnectionTime = 0;              // last time you connected to the server, in milliseconds
const unsigned long postingInterval = 7000;       // delay between updates, in milliseconds
Next, we create the variables that will be used to store the data to be obtained from the ENV Shield.
We start by initializing Serial communication to help with debugging the code, setting the baud rate to 9600. After this, we initialize the display, change the screen color to black, initialize the ENV shield, and use the connectToWiFi() function to connect to the specified SSID.
void setup() {

  Serial.begin(9600);
  //while (!Serial); // wait for serial port to connect. Needed for native USB port only

  // Init ST7735R chip, green tab
  tft.initR(INITR_144GREENTAB);

  tft.fillScreen(ST77XX_BLACK);

  // Init MKR ENV shield
  if (!ENV.begin()) {
    Serial.println("Failed to initialize MKR ENV shield!");
    while (1);
  }

  connectToWIFI();

}
Next, we write the voidloop() function.
The code for the voidloop() is simple thanks to the libraries we are using and a few functions.
We start the voidloop() by checking if the posting interval has elapsed as the Adafruit IO has a specified interval of seconds between data uploads for free access. If the time has elapsed, we then use the readsensor() function to obtain data from the ENV shield and call the displayValuesOnTFT() function to display the values. The displayValuesOnSerial() function is used to print the values on the serial monitor for debugging and the httpRequest() function is used to send the data to the cloud.
void loop() {

 // if 7 seconds have passed since your last connection,
  // then connect again and send data:
  if (millis() - lastConnectionTime > postingInterval)
  {
    readSensors();
    displayValuesOnTFT();
    displayValuesOnSerial();
    httpRequest(); // send data to Cloud
  }

}
To take a closer look at these functions,
The readsensors() functions contain code to probe the ENV shield for each of the parameters we intend to measure and equate it to the corresponding variable name.
The HTTP request function combines the values from the readsensor() function together in a JSON format (Key and value pair) and sends to Adafruit IO. The status of the data upload is displayed on the TFT and the variable; lastConnectionTime is updated to determine when the next data is sent.
void httpRequest()
{


/*
 * https://io.adafruit.com/api/docs/#operation/createGroupData
 *
 * POST /{username}/groups/{group_key}/data
 *
 * JSON:
 *
{
  "location": {
    "lat": 0,
    "lon": 0,
    "ele": 0
  },
  "feeds": [
    {
      "key": "string",
      "value": "string"
    }
  ],
  "created_at": "string"
}
 */

  const size_t capacity = JSON_ARRAY_SIZE(3) + 3*JSON_OBJECT_SIZE(2) + 2*JSON_OBJECT_SIZE(3) + 130;
  StaticJsonDocument<capacity> doc;

   // Add the "location" object
  JsonObject location = doc.createNestedObject("location");
  location["lat"] = 0;
  location["lon"] = 0;
  location["ele"] = 0;

  // Add the "feeds" array
  JsonArray feeds = doc.createNestedArray("feeds");
  JsonObject feed1 = feeds.createNestedObject();
  feed1["key"] = "temperature";
  feed1["value"] = _temperature;
  JsonObject feed2 = feeds.createNestedObject();
  feed2["key"] = "humidity";
  feed2["value"] = _humidity;
  JsonObject feed3 = feeds.createNestedObject();
  feed3["key"] = "pressure";
  feed3["value"] = _pressure;
  JsonObject feed4 = feeds.createNestedObject();
  feed4["key"] = "light_intensity";
  feed4["value"] = _lux;


  // close any connection before send a new request.
  // This will free the socket on the Nina module
  client.stop();

  Serial.println("\nStarting connection to server...");
  if (client.connect(server, 80))
  {
    Serial.println("connected to server");
    // Make a HTTP request:
    client.println("POST /api/v2/" IO_USERNAME "/groups/" IO_GROUP "/data HTTP/1.1");
    client.println("Host: io.adafruit.com");
    client.println("Connection: close");
    client.print("Content-Length: ");
    client.println(measureJson(doc));
    client.println("Content-Type: application/json");
    client.println("X-AIO-Key: " IO_KEY);

    // Terminate headers with a blank line
    client.println();
    // Send JSON document in body
    serializeJson(doc, client);

    // note the time that the connection was made:
    lastConnectionTime = millis();

    testdrawtext(5,120,"data sent to Cloud!", ST77XX_WHITE,1);
    Serial.println("data sent!");

  } else {
    // if you couldn't make a connection:
    testdrawtext(10,120,"connection failed!", ST77XX_WHITE,1);
    Serial.println("connection failed!");
  }


}
The displayValuesOnTFT() function, on the other hand, is used to display the values from the readsensor() function on the TFT display. The function starts by converting all the values to the string after which they are displayed using the testdrawtext() function.
The testdrawtext() function takes several arguments including the screen coordinates where the text is to be written, the text/value to be written, color and font size. We have covered the use of the st77xx displays in several tutorials, you can check them out to learn more about the functions.
The complete code for this part is available below and also attached under the download section. You can either jump straight to the demo section from here or follow part 2.
Part 2: Receiving Data from the cloud
As mentioned during the introduction, for this second part, we will examine how you can send commands from the cloud to the device to initiate actions. For this example, we will toggle a switch on the dashboard and a text(on/off) corresponding to the state of the switch will be displayed on the RGB shield.
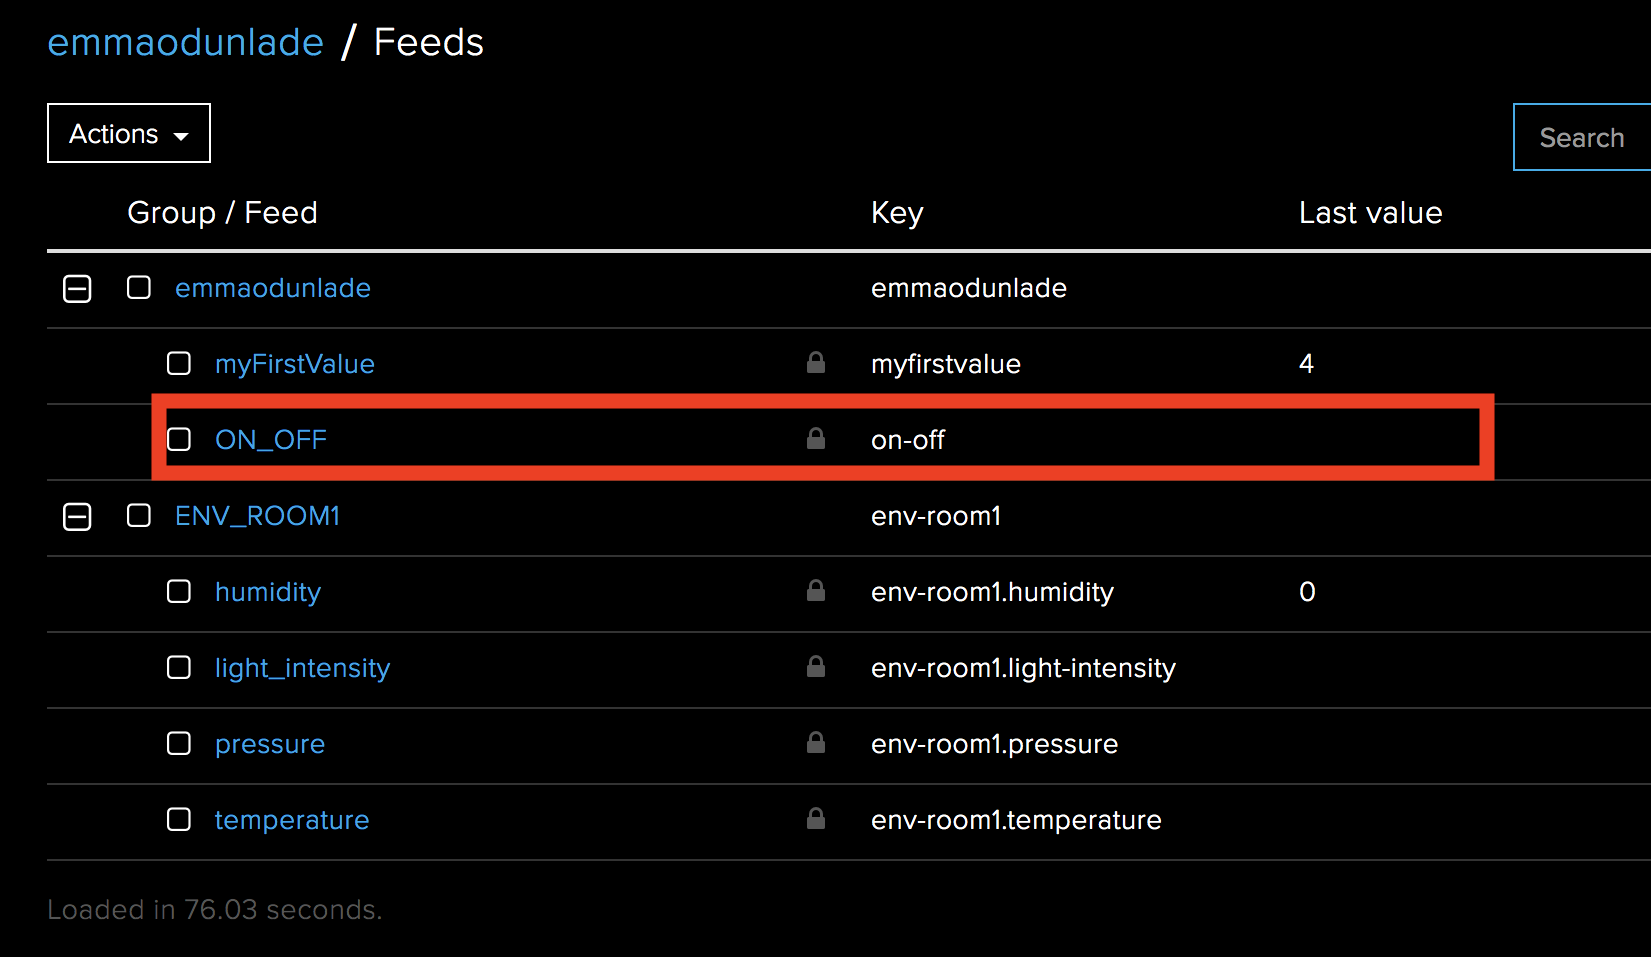
We start by creating a new feed called ON_OFF. This time under the defaults group.
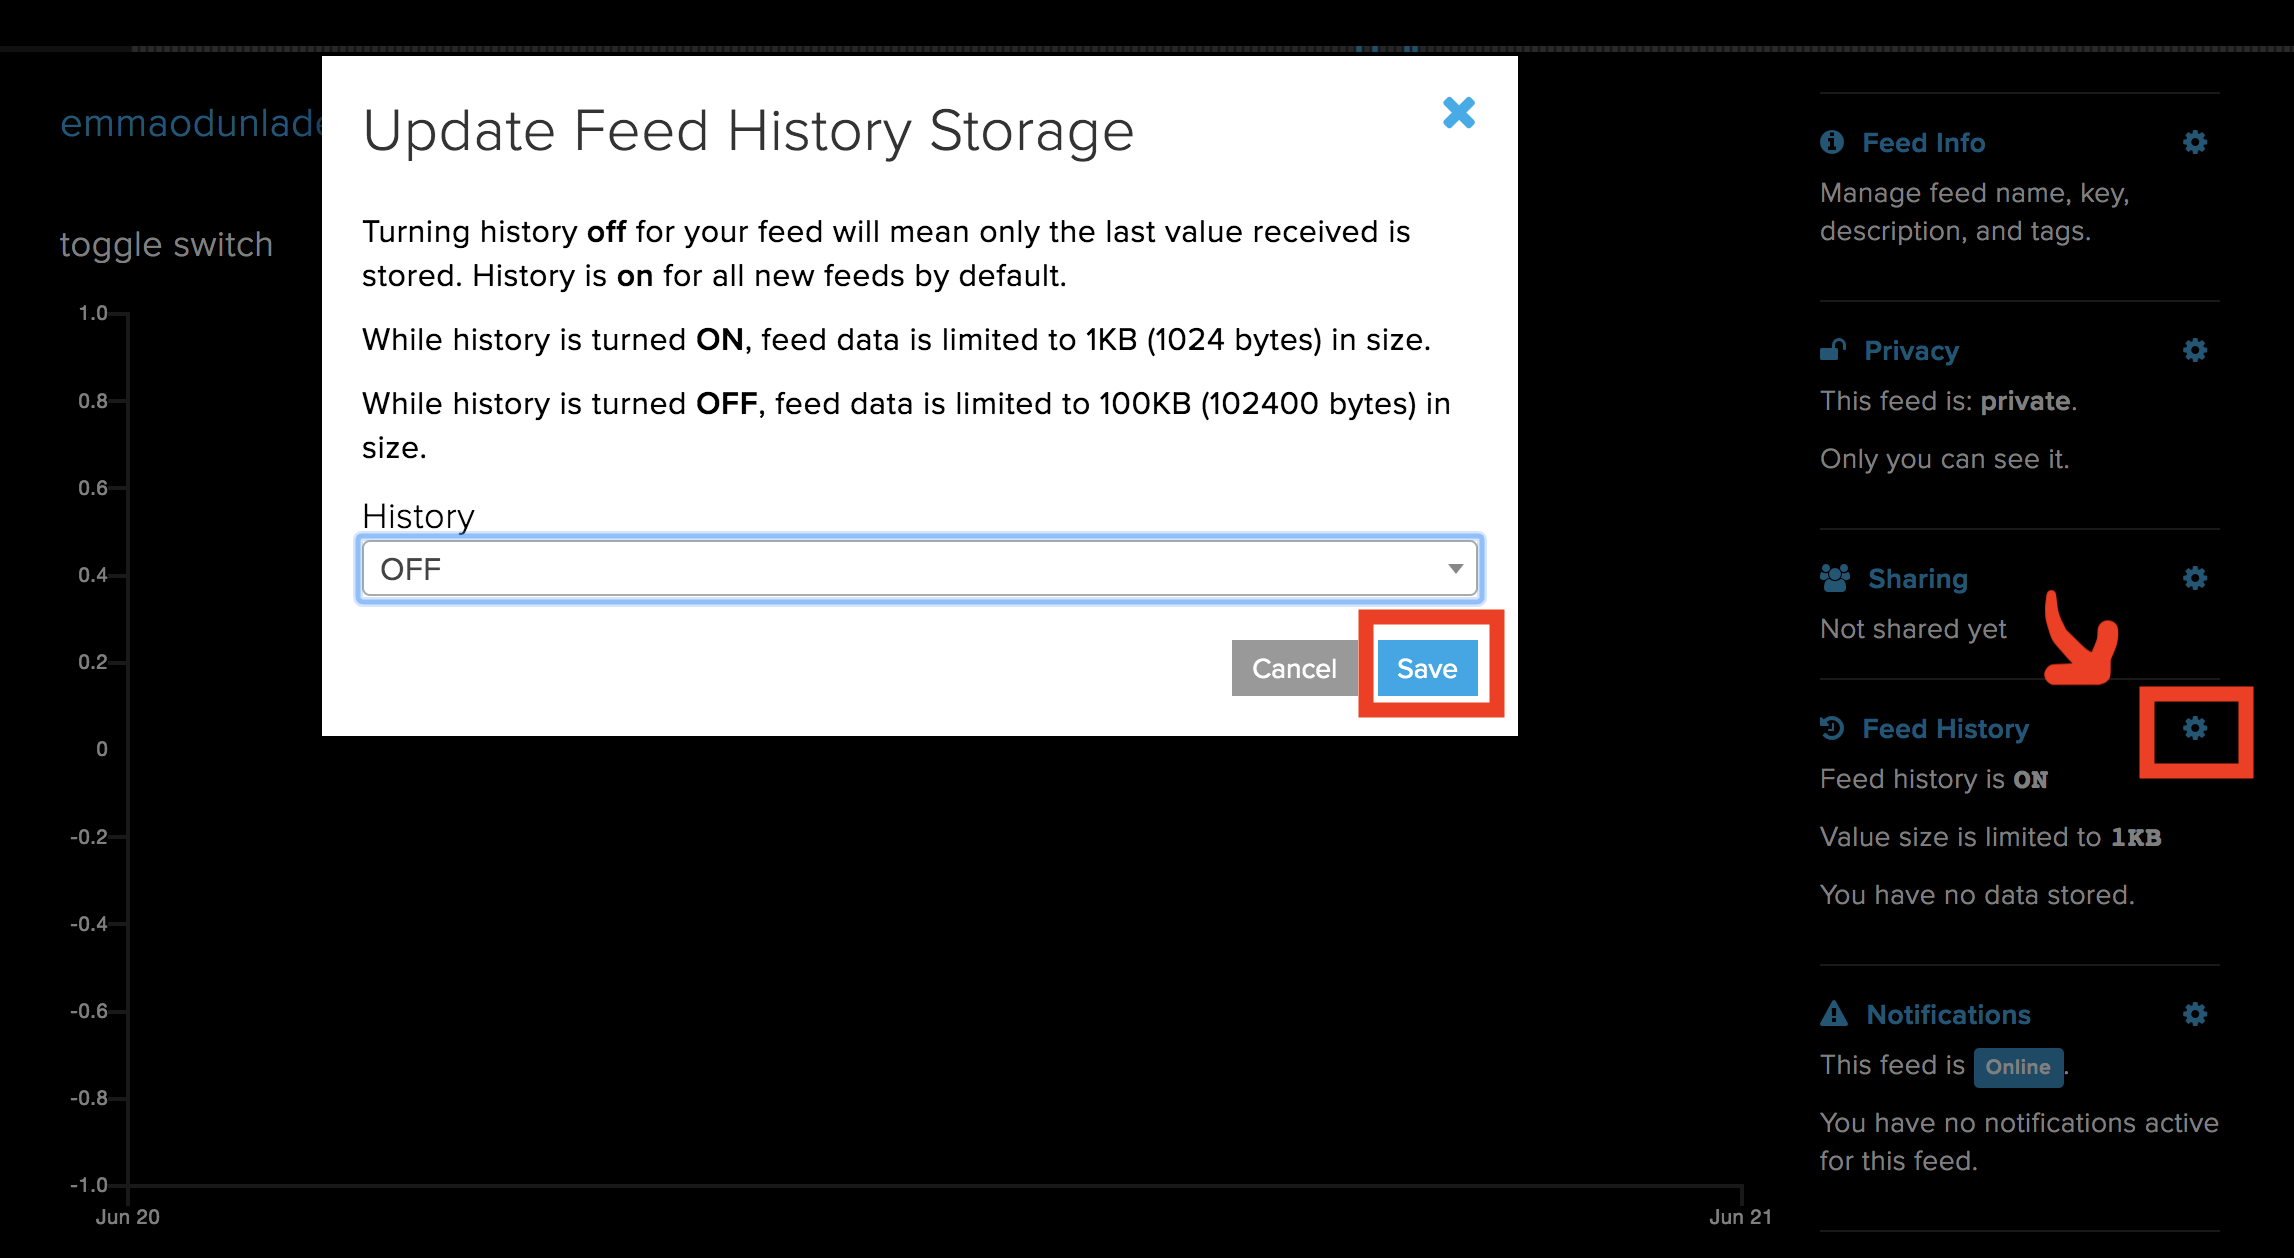
Next, we turn the feed history off so only the current data is available.
Turn off Feed History
It should now be visible with the other feeds as shown below.
ON_OFF Feed Created
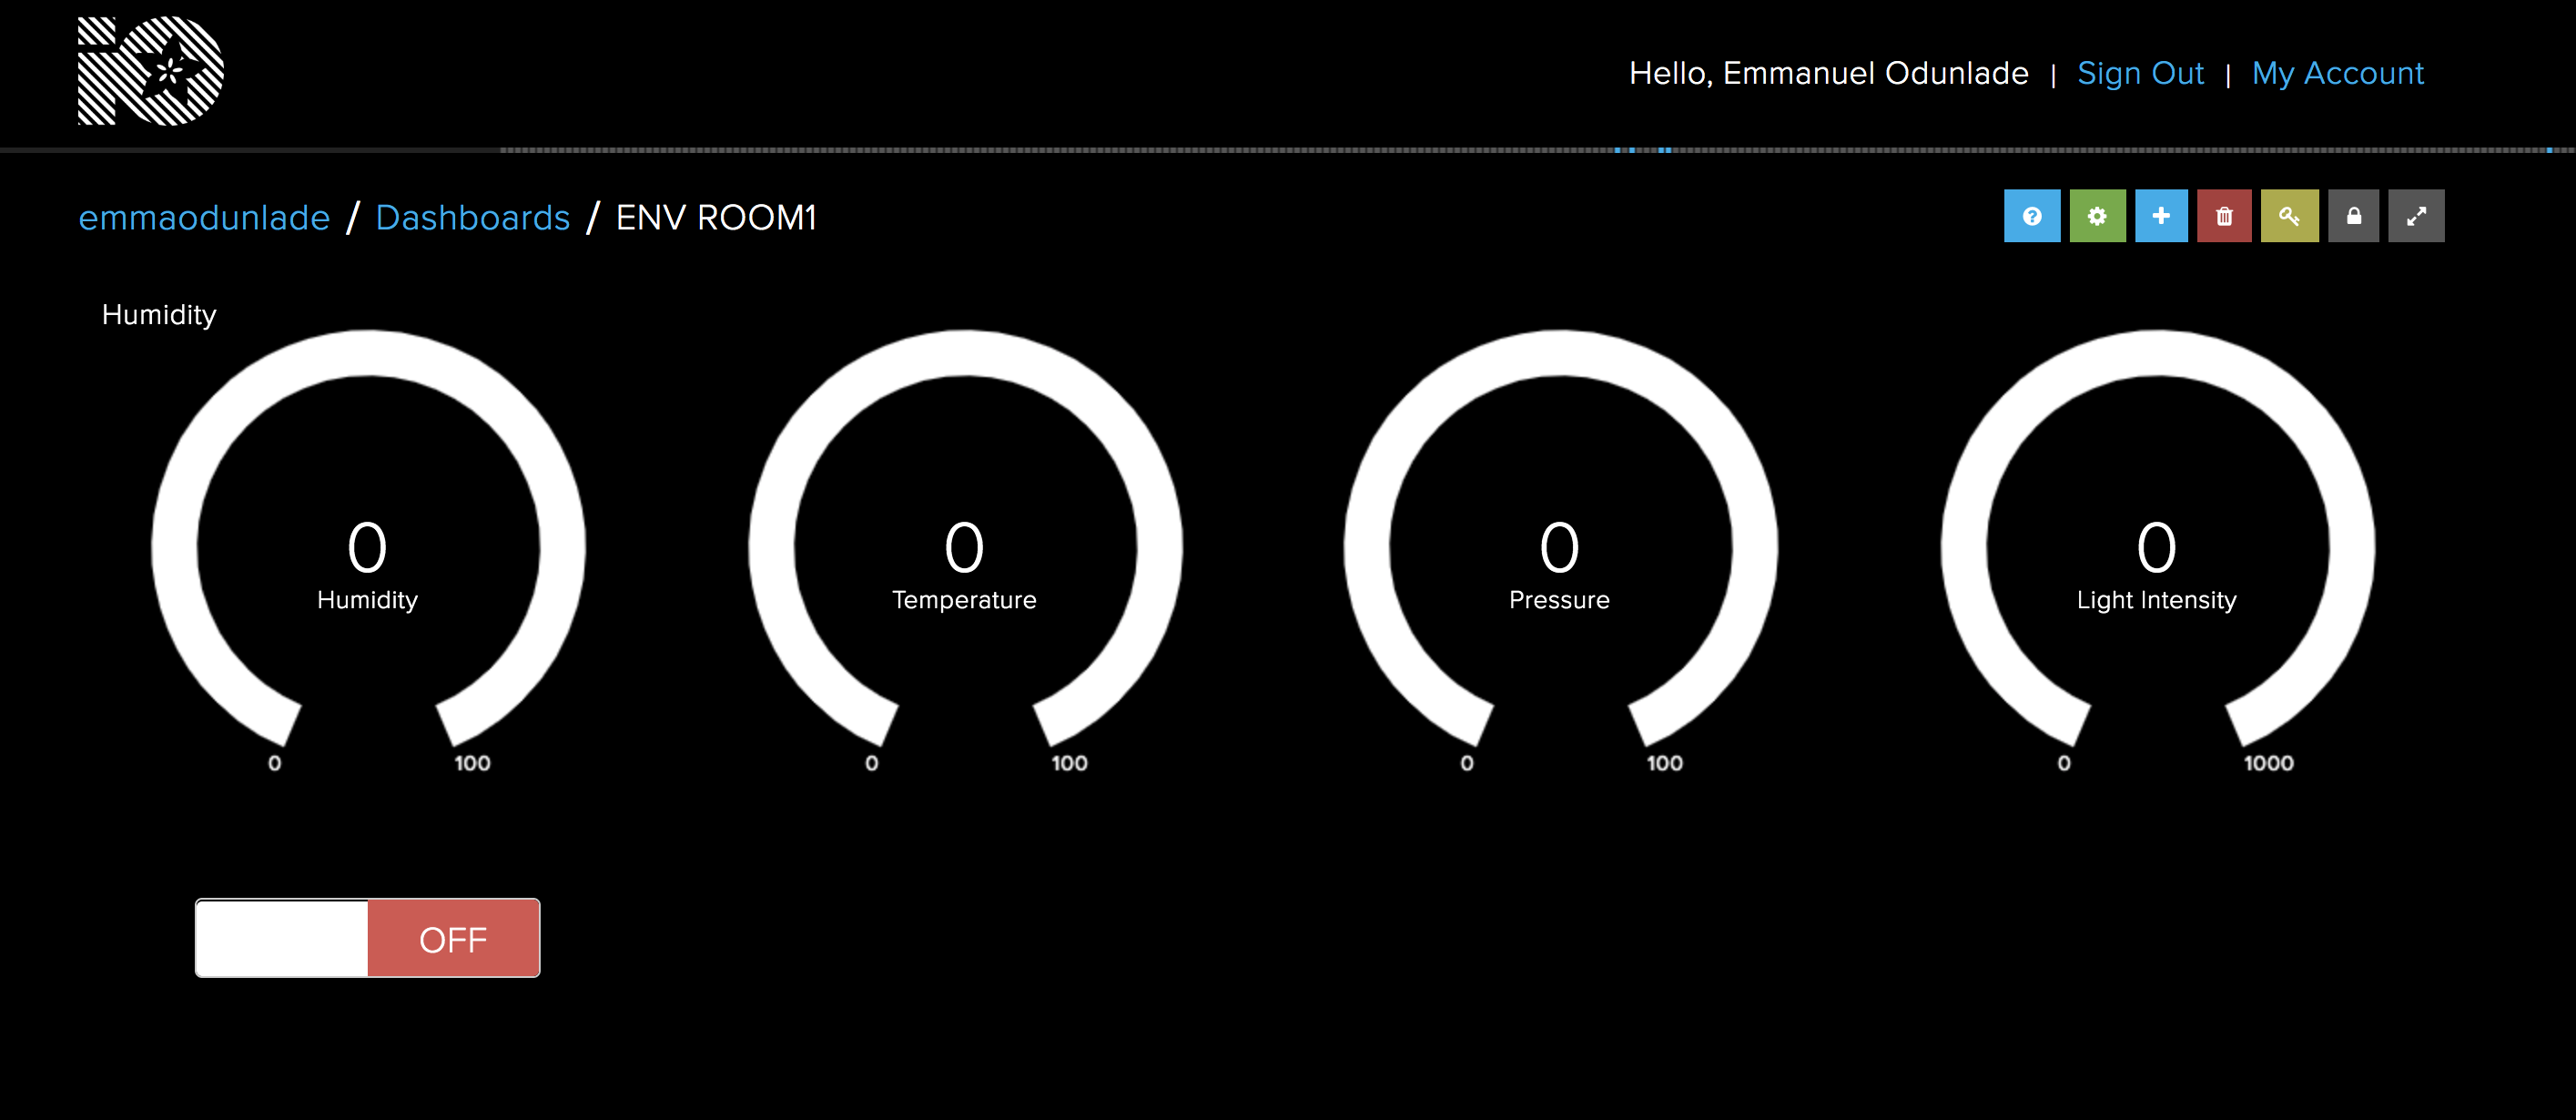
Next, we go to the dashboard we created earlier, click the “+” sign and select a toggle switch widget. Fill that dialog box that opens, entering the feed name and other details just like we did for the ones in the first part. You can decide to do this on a new dashboard since we are not focusing on combining both parts of the tutorial.
Dashboard with Toggle Button
With this done, we can proceed to write the code. Just like the first part, in addition to the Adafruit IO REST API (v2.0.0) and the WIFININA library, we will use the MKR RGB Library, the Arduino Json Library and the Arduino Graphics library.
As usual, we start the code by including the libraries that we will use for the project.
Next, we create variables to hold the WiFi credentials. These variables must be entered in the Arduino_Secrets.h file which it is needed to be placed in the same folder as the sketch. We also specify the IO Server and create an object of the WiFi Client Library.
√√char ssid[] = SECRET_SSID; // your network SSID (name)
char pass[] = SECRET_PASS; // your network password (use for WPA, or use as key for WEP)
int status = WL_IDLE_STATUS;
char server[] = "io.adafruit.com"; // name address for Adafruit IOT Cloud
Initialize the client library
WiFiClient client;
Next, we write the void setup function. We start by initializing serial communication, setting the baud rate at 9600. Next we initialize the RGB matrix using the function MATRIX.begin().
With this done, we set the brightness of the display, set the speed at which text scrolls on the display and clear it in preparation for texts to be displayed on it. To wrap up the setup function, the board is connected to wifi using the ConnectToWIFI function.
// set the brightness, supported values are 0 - 255
MATRIX.brightness(200);
// configure the text scroll speed
MATRIX.textScrollSpeed(125);
MATRIX.clear();
MATRIX.endDraw();
ConectToWIFI();
}
Up next is the void loop() function.
Here we start by calling the httpRequest() function to obtain the current state of the toggle switch. If the state is on(1), we clear the RGB display, set the cursor and display “ON” on it, scrolling it left. If the state is off(0), the RGB is cleared, cursor positioned and the “OFF” text is displayed scrolling left. However, if the httpRequest() function returns no valid state due to connectivity issues or any other reason, a blank screen is displayed. The state is displayed on the serial monitor for debugging reasons.
void loop() {
httpRequest();
if (state == 1)
{
MATRIX.clear();
MATRIX.endDraw();
MATRIX.beginText(0, 0, 0, 127, 0); // X, Y, then R, G, B
MATRIX.print(" ON");
MATRIX.endText(SCROLL_LEFT);
}else if (state == 0)
{
MATRIX.clear();
MATRIX.endDraw();
MATRIX.beginText(0, 0, 127, 0, 0); // X, Y, then R, G, B
MATRIX.print(" OFF");
MATRIX.endText(SCROLL_LEFT);
}else
{
MATRIX.clear();
MATRIX.endDraw();
}
Serial.println(state);
}
The complete code for this part is available below and under the download section.
#include <ArduinoJson.h>
#include <ArduinoGraphics.h>
#include <Arduino_MKRRGB.h>
#include <WiFiNINA.h>
#include "arduino_secrets.h"
char ssid[] = SECRET_SSID; // your network SSID (name)
char pass[] = SECRET_PASS; // your network password (use for WPA, or use as key for WEP)
int status = WL_IDLE_STATUS;
char server[] = "io.adafruit.com"; // name address for Adafruit IOT Cloud
///////////////////////////
// Initialize the client library
WiFiClient client;
int state = 2;
void setup() {
Serial.begin(9600);
//while (!Serial); // wait for serial port to connect. Needed for native USB port only
// initialize the display
MATRIX.begin();
// set the brightness, supported values are 0 - 255
  MATRIX.brightness(200);

   // configure the text scroll speed
  MATRIX.textScrollSpeed(125);

  MATRIX.clear();
  MATRIX.endDraw();

  ConectToWIFI();

}
void loop() {

    httpRequest();
    if (state == 1)
    {
      MATRIX.clear();
      MATRIX.endDraw();
      MATRIX.beginText(0, 0, 0, 127, 0); // X, Y, then R, G, B
      MATRIX.print(" ON");
      MATRIX.endText(SCROLL_LEFT);

    }else if (state == 0)
    {
      MATRIX.clear();
      MATRIX.endDraw();
      MATRIX.beginText(0, 0, 127, 0, 0); // X, Y, then R, G, B
      MATRIX.print(" OFF");
      MATRIX.endText(SCROLL_LEFT);
    }else
    {
      MATRIX.clear();
      MATRIX.endDraw();
    }

    Serial.println(state);

}
// this method makes a HTTP connection to the server:
void httpRequest()
{
// JSon
/*
* GET: /api/v2/{username}/feeds/{feed_key}/data/last
{
"id": "string",
"value": "string",
"feed_id": 0,
"group_id": 0,
"expiration": "string",
"lat": 0,
"lon": 0,
"ele": 0,
"completed_at": "string",
"created_at": "string",
"updated_at": "string",
"created_epoch": 0
}
*/
// close any connection before send a new request.
// This will free the socket on the Nina module
client.stop();
Serial.println("\nStarting connection to server...");
if (client.connect(server, 80))
{
Serial.println("connected to server");
// Make a HTTP request:
client.println("GET /api/v2/" IO_USERNAME "/feeds/on-off/data/last HTTP/1.1");
client.println("Host: io.adafruit.com");
client.println("Connection: close");
client.println("Content-Type: application/json");
client.println("X-AIO-Key: " IO_KEY);
// Terminate headers with a blank line
if (client.println() == 0) {
Serial.println(F("Failed to send request"));
return;
}
// Check HTTP status
char status[32] = {0};
client.readBytesUntil('\r', status, sizeof(status));
if (strcmp(status, "HTTP/1.1 200 OK") != 0) {
Serial.print(F("Unexpected response: "));
Serial.println(status);
return;
}
// Skip HTTP headers
char endOfHeaders[] = "\r\n\r\n";
if (!client.find(endOfHeaders)) {
Serial.println(F("Invalid response1"));
return;
}
// Skip Adafruit headers
char endOfHeaders2[] = "\r";
if (!client.find(endOfHeaders2)) {
Serial.println(F("Invalid response2"));
return;
}
//Deserialize JSon
const size_t capacity = JSON_OBJECT_SIZE(12) + 170;
StaticJsonDocument<capacity> doc;
DeserializationError error = deserializeJson(doc, client);
if (error) {
Serial.print(F("deserializeJson() failed: "));
Serial.println(error.c_str());
return;
}
const char* value = doc["value"];
Serial.print("get data!:");
Serial.println(value);
if (strcmp(value, "ON") == 0)
state = 1;
else if (strcmp(value, "OFF") == 0)
state = 0;
else
state = 2;
} else {
// if you couldn't make a connection:
Serial.println("connection failed");
state = 2;
}
}
void ConectToWIFI()
{
// check for the WiFi module:
if (WiFi.status() == WL_NO_MODULE) {
Serial.println("Communication with WiFi module failed!");
// don't continue
while (true);
}
String fv = WiFi.firmwareVersion();
if (fv < "1.0.0") {
Serial.println("Please upgrade the firmware");
}
// attempt to connect to Wifi network:
while (status != WL_CONNECTED) {
Serial.print("Attempting to connect to SSID: ");
Serial.println(ssid);
// Connect to WPA/WPA2 network. Change this line if using open or WEP network:
status = WiFi.begin(ssid, pass);
// wait 10 seconds for connection:
delay(10000);
}
Serial.println("Connected to wifi");
printWifiStatus();
}
void printWifiStatus() {
// print the SSID of the network you're attached to:
Serial.print("SSID: ");
Serial.println(WiFi.SSID());
// print your board's IP address:
IPAddress ip = WiFi.localIP();
Serial.print("IP Address: ");
Serial.println(ip);
// print the received signal strength:
long rssi = WiFi.RSSI();
Serial.print("signal strength (RSSI):");
Serial.print(rssi);
Serial.println(" dBm");
}
Demo
With the sketches all done, is time to test out the code.
Just like we did for both the schematics and programming sections, we will also separate the demo into two parts as I believe you will most likely use the same MKR WiFi 1010 board for both parts.
Part 1 Demo
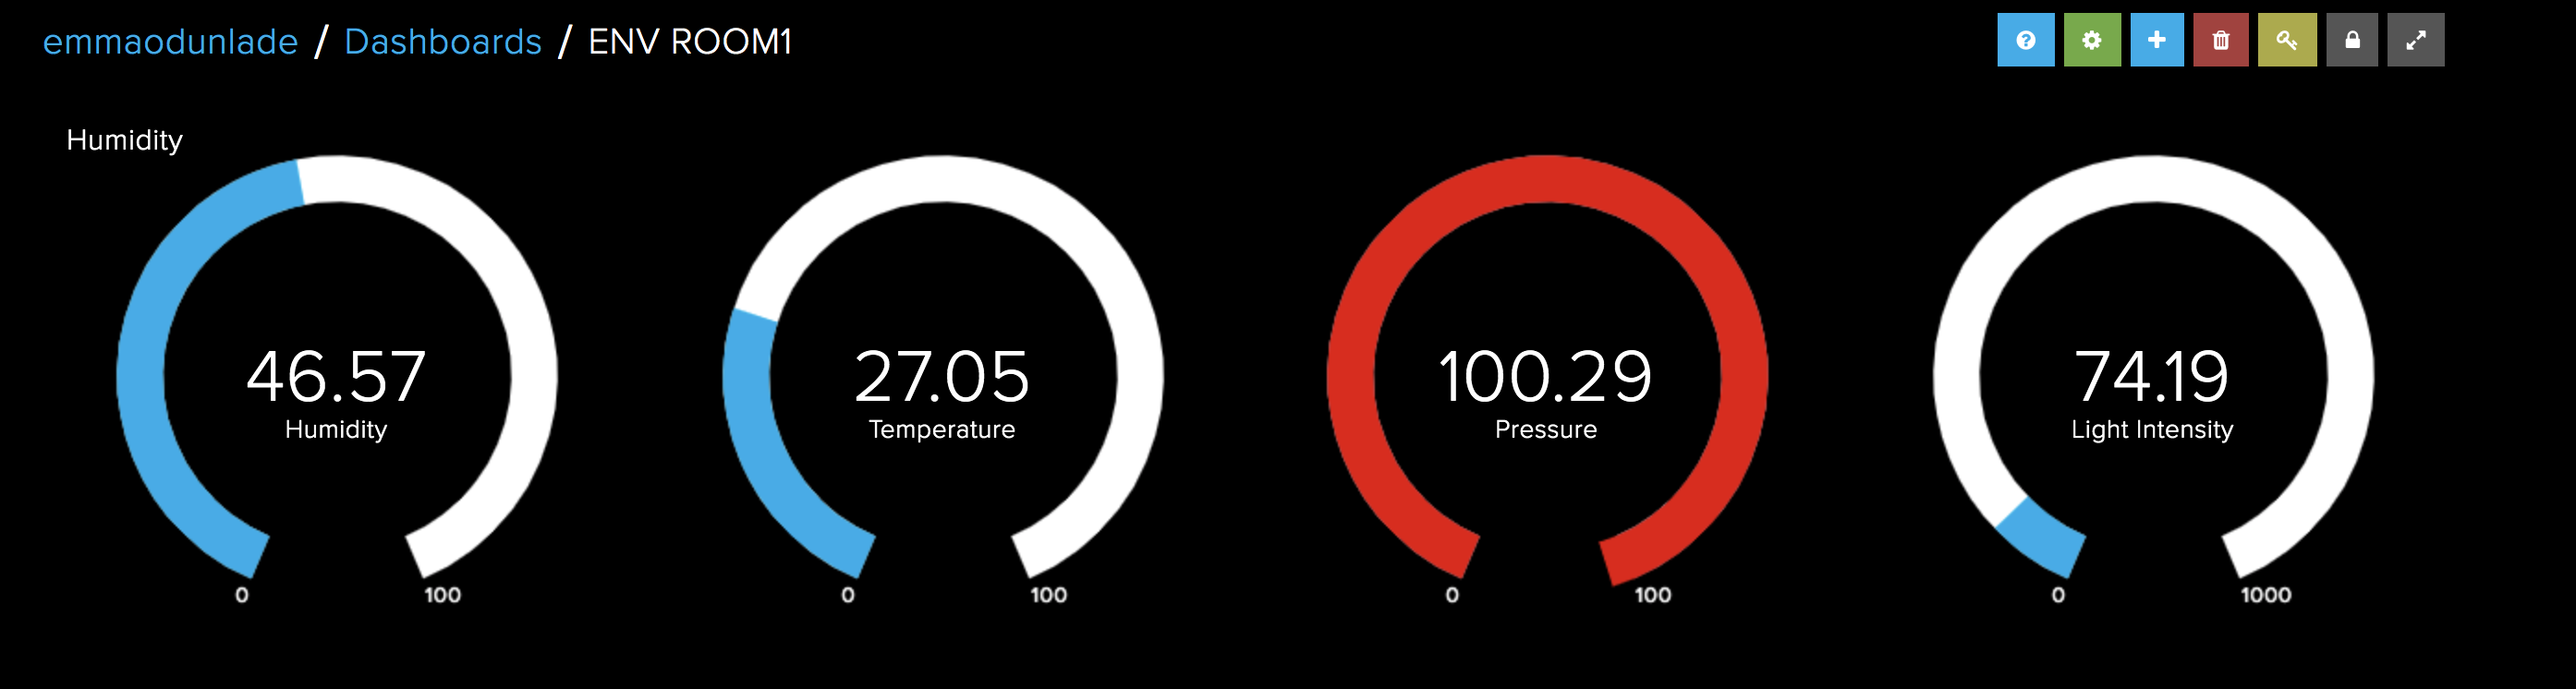
At this stage, we are ready to upload the code to the Arduino MKR WiFi 1010 board. Double check the connections between the Arduino and TFT LCD, and ensure the ENV shield is well plugged in. Also, check to ensure you have filled the credentials for the WiFi access point and your Adafruit IO account in the Arduino_secrets.h file. With this done, upload the code to the Arduino board. After a few minutes, you should see the data live on the Adafruit IO dashboard and the TFT display as shown in the image below.
Demo 1
Part 2 Demo
For the Part 2, Plug in the MKR RGB Shield into the MKR WiFi 1010 board as described under the schematics section and double check to ensure you have filled the credentials for the WiFi access point in the Arduino_Secrets.h file.
With everything in place, upload the code to the board and toggle the switch on the dashboard. You should see the text “on”/”off” being displayed on the RGB as you toggle the switch between “on” and “off”.
Demo 2
It is important to note that you can combine both sketches to build a system capable of two way communication with the IoT Cloud. We just separated things so as to be able to explain the steps in details. As a learning challenge, you can try combining the code for both parts or creating a similar project and test it out. That’s it for today’s tutorial, feel free to reach out to me via the comment section with questions and any general comment about today’s project.
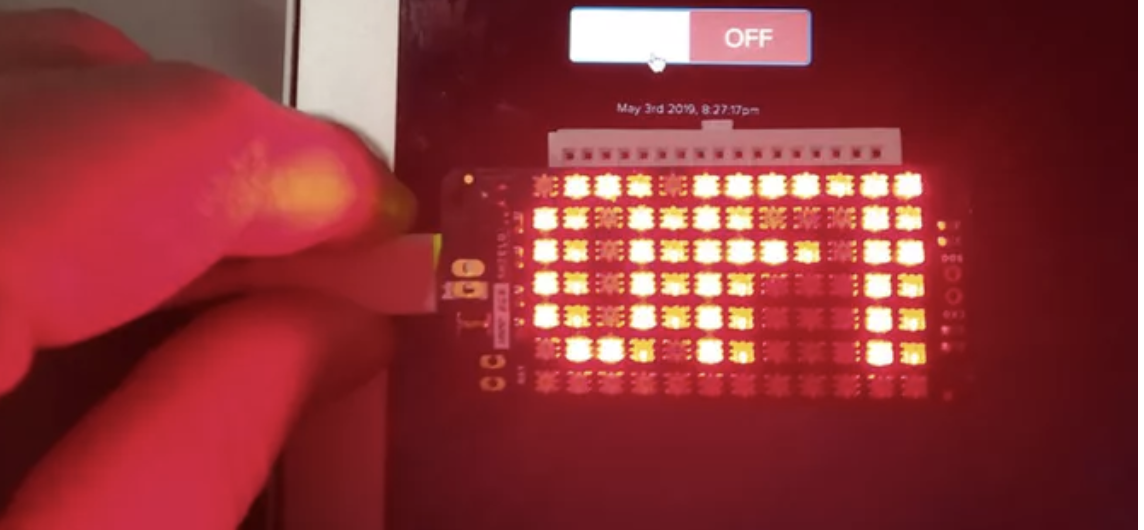
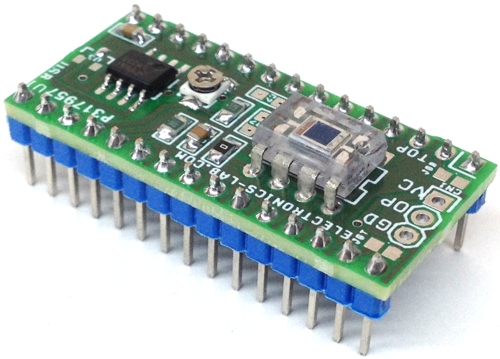
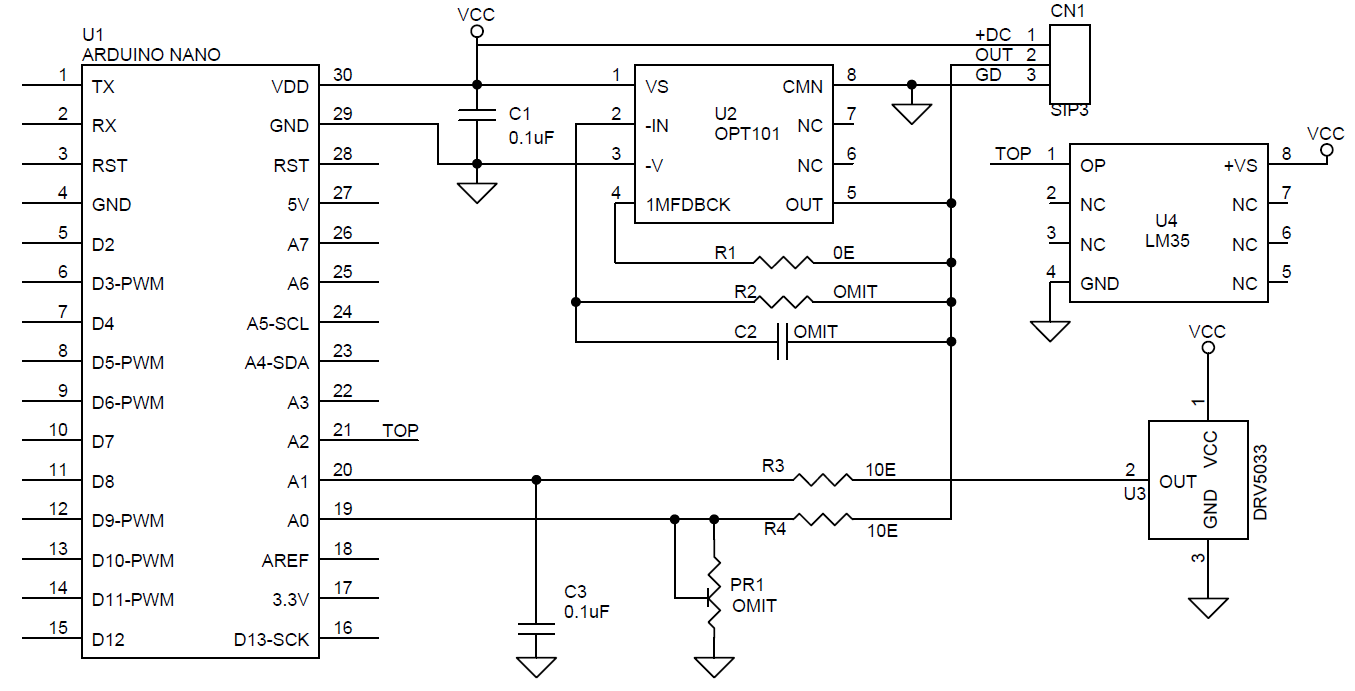
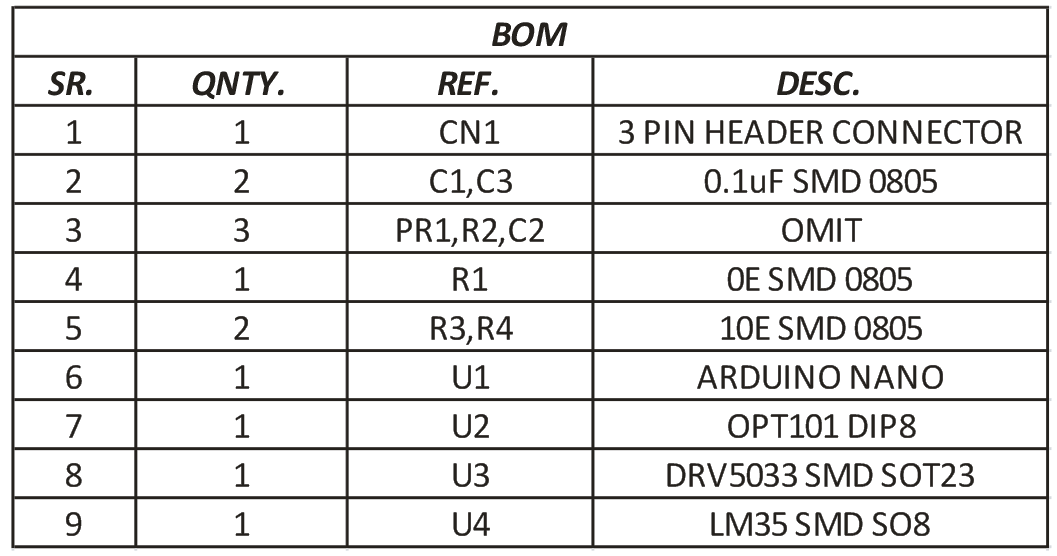
This Arduino Nano Shield consists of a Light sensor, a Magnetic field sensor, and Temperature sensor. The shield can be used to develop various projects required light sensing, magnetic field sensing, and temperature sensing. All sensors provide analog voltage outputs, so each output is connected to analog inputs of Arduino Nano.
Sensors
OPT101 High Sensitive Light Sensor with Adjustable Gain ( Analog Output)
DRV5053 Magnetic Field Sensor ( Analog Output)
LM35 Temperature Sensor ( Analog Output)
Arduino Nano Interface
OPT101 Light sensor output connected to Analog pin of Arduino Nano
Magnetic Field Sensor output connected to Analog pin of Arduino Nano
LM35 Sensor output connected to Analog pin of Arduino Nano
Output
OPT101 provides 7.5mV to 4V ( Minimum Dark Output 7.5V)
DRV5053 Magnetic Field Sensor Output 0-1.8V
LM35 Temperature Sensor Linear + 10-mV/°C Scale Factor
Multi Sensor Shield for Arduino Nano with Light, Magnetic Field & Temperature Sensor – [Link]
This Arduino Nano Shield consists of a Light sensor, a Magnetic field sensor, and Temperature sensor. The shield can be used to develop various projects required light sensing, magnetic field sensing, and temperature sensing. All sensors provide analog voltage outputs, so each output is connected to analog inputs of Arduino Nano.
Sensors
OPT101 High Sensitive Light Sensor with Adjustable Gain ( Analog Output)
DRV5053 Magnetic Field Sensor ( Analog Output)
LM35 Temperature Sensor ( Analog Output)
Arduino Nano Interface
OPT101 Light sensor output connected to Analog pin of Arduino Nano
Magnetic Field Sensor output connected to Analog pin of Arduino Nano
LM35 Sensor output connected to Analog pin of Arduino Nano
Output
OPT101 provides 7.5mV to 4V ( Minimum Dark Output 7.5V)
DRV5053 Magnetic Field Sensor Output 0-1.8V
LM35 Temperature Sensor Linear + 10-mV/°C Scale Factor
Power Supply: All Sensors connected to 5V of Arduino Nano
OPT101
The OPT101 is a monolithic photodiode with op-chip transimpidance amplifier. The integrated combination of the photodiode and transimpidance amplifier on a single chip eliminates the problems commonly encountered in discrete designs, such as leakage current errors, noise pickup, and gain peaking as result of stray capacitance. Output voltage increases linearly with light intensity. The power amplifier works on single supply. The 2.29mm X 2.29 mm photodiode operates in the photoconductive mode for excellent linearity and low dark current.
The OPT101 is a large-area photodiode integrated with an optimized operational amplifier that makes the OPT101 a small, easy-to-use, light-to-voltage device. The photodiode has a very large measurement area that collects a significant amount of light, and thus allows for high-sensitivity measurements. The photodiode has a wide spectral response with a maximum peak in the infrared spectrum, and a useable range from 300 nm to 1100 nm. from all-analog circuits to data conversion base circuits. The on-chip voltage source keeps the amplifier in a good operating region, even at low light levels. The OPT101 voltage output is the product of the photodiode current times the feedback resistor, (IDRF), plus a pedestal voltage, VB, of approximately 7.5 mV introduced for single-supply operation. Output is 7.5 mV dc with no light, and increases with increasing illumination. Photodiode current, ID, is proportional to the radiant power, or flux, (in watts) falling on the photodiode. At a wavelength of 650 nm (visible red) the photodiode responsively, RI, is approximately 0.45 A/W. Responsively at other wavelengths is shown in Figure 1. The internal feedback
resistor is laser trimmed to 1 MΩ. Using this resistor, the output voltage responsively, RV, is approximately 0.45 V/μW at 650-nm wavelength.
See Figure 2 for the response throughout a wide range of radiant power in microwatts. Figure 3 shows the response throughout a wide range of irradiance in watts per square meter. 8.3.1 Dark Performance the dark errors in the Electrical Characteristics table include all sources. The dominant source of dark output voltage is the pedestal voltage applied to the no inverting input of the op amp. This voltage is introduced to
provide linear operation in the absence of light falling on the photodiode. Photodiode dark current is approximately 2.5 pA, and contributes virtually no offset error at room temperature. The bias current of the op amp summing junction (negative input) is approximately 165 pA. The dark current is subtracted from the amplifier bias current, and these residual current flows through the feedback resistor creating an offset. The effects of temperature on this difference current are seen in Figure 10. The dark output voltage is trimmed to zero with the optional circuit shown in Figure 17. Use a low-impedance offset driver (op amp) to drive pin 8 (Common) because this node has signal-dependent currents.
Responsively To set a different voltage responsively , connect an external resistor, REXT. To increase the responsively, place this resistor in series with the internal 1-MΩ resistor (Figure 18), or replace the internal resistor with an external resistor by not connecting pin 4 (Figure 19). The second configuration also reduces the circuit gain below 106 V/A when using external resistors that are less than 1 MΩ. Shows the basic circuit connections for the OPT101 operating with a single power supply and using the internal 1-MΩ feedback resistor for a response of 0.45 V/μW at 650 nm. Pin 3 (–V) is connected to common in this configuration. Applications with high-impedance power supplies may require decoupling capacitors located close to the device pins as shown.
DRV5053
The DRV5053 device is a chopper-stabilized Hall IC that offers a magnetic sensing solution with superior sensitivity stability over temperature and integrates protection features The 0- to 2-V analog output responds linearly to the applied magnetics flux density, and distinguishes the polarity of magnetic field direction. Internal protection functions are provided for reverse supply conditions, load dump, and output short circuit or overcurrent.
The DRV5053 device is a chopper-stabilized Hall sensor with an analog output for magnetic sensing applications. Note that the DRV5053 device will not be operating when approximately –22 to 2.4 V is applied to VCC (with respect to GND). In addition, the device can withstand supply voltages up to 40 V for transient durations. The output voltage is dependent on the magnetic field perpendicular to the package. The absence of a magnetic field will result in OUT = 1 V. A magnetic field will cause the output voltage to change linearly with the magnetic
field. The field polarity is defined as follows: a south pole near the marked side of the package is a positive magnetic field. A north pole near the marked side of the package is a negative magnetic field. For devices with a negative sensitivity (that is, DRV5053RA: –40 mV/mT), a south pole will cause the output voltage to drop below 1 V, and a north pole will cause the output to rise above 1 V. For devices with a positive sensitivity (that is, DRV5053EA: +40 mV/mT), a south pole will cause the output voltage to rise above 1 V, and a north pole will cause the output to drop below 1 V.
LM35
The LM35 series are precision integrated-circuit temperature devices with an output voltage linearly-proportional to the Centigrade temperature. The LM35 device has an advantage over linear temperature sensors calibrated in Kelvin, as the user is not required to subtract a large constant voltage from the output to obtain convenient Centigrade scaling. The LM35 device does not require any external calibration or trimming to provide typical accuracies of ±¼°C at room temperature and ±¾°C over a full −55°C to 150°C temperature range. Lower cost is assured by trimming and calibration at the wafer level. The low-output impedance, linear output and precise inherent calibration of the LM35 device makes interfacing to readout or control circuitry especially easy. The device is used with single power supplies, or with plus and minus supplies. As the LM35 device draws only 60 µA from the supply, it has very low self-heating of less than 0.1°C in still air. The LM35 device is rated to operate over a −55°C to 150°C temperature range, while the LM35C device is rated for a −40°C to 110°C range (−10° with improved accuracy). The LM35-series devices are available packaged in hermetic TO transistor packages, while the LM35C, LM35CA, and LM35D devices are available in the plastic TO-92 transistor package. The LM35D device is available in an 8-lead surface-mount small-outline package and a plastic TO-220 package.
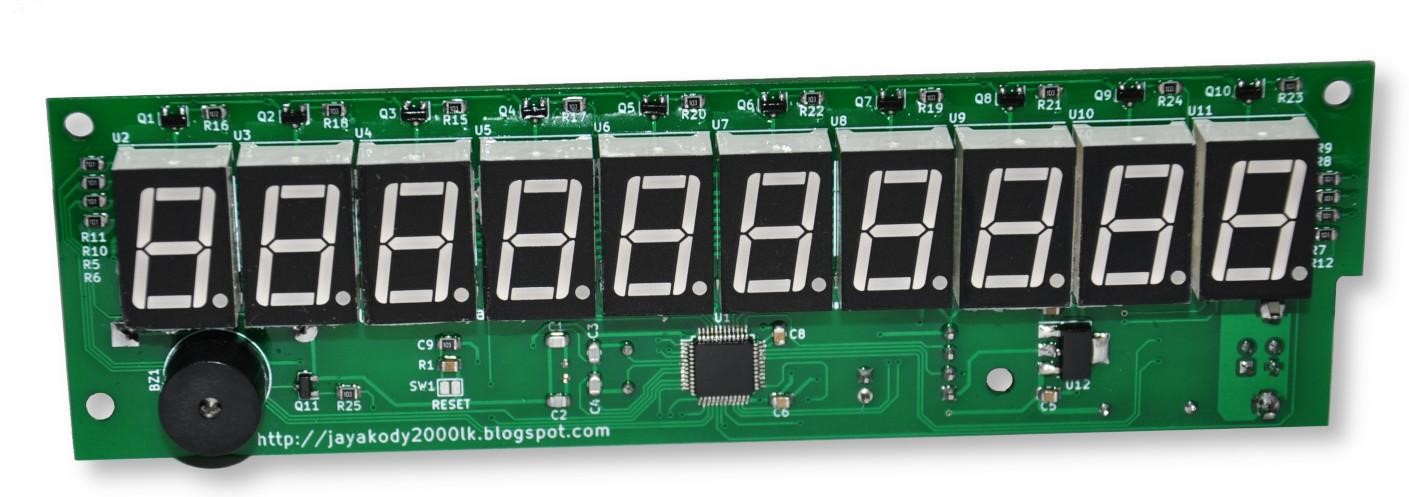
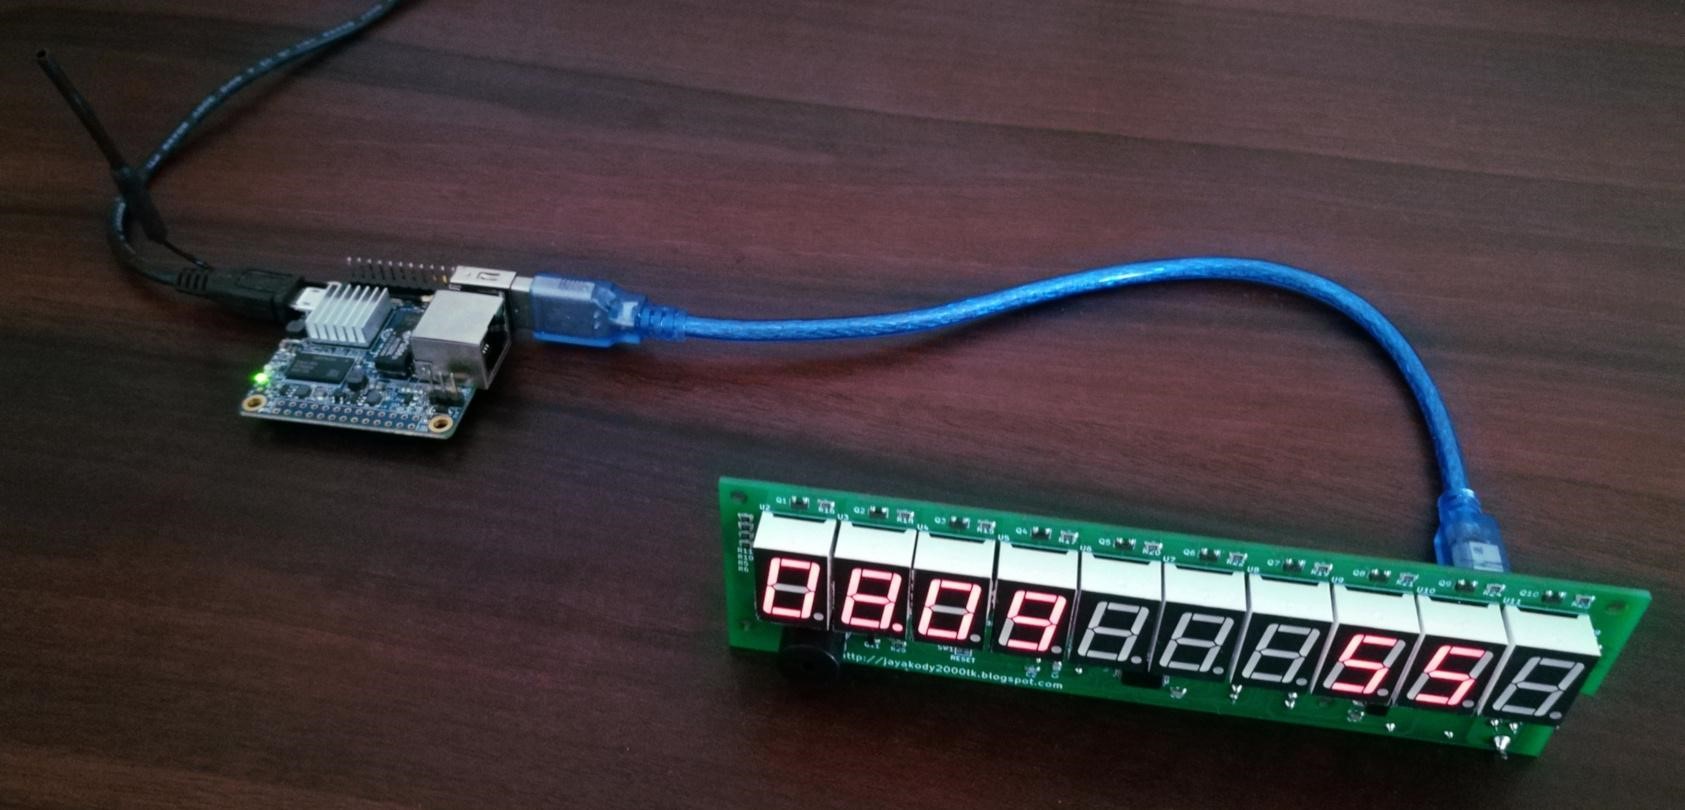
This project is about an open-source, USB based, 10 digit seven segment display unit. This unit is specifically designed to work with POS systems and banking applications. Initially, this system is developed to work with PC based POS systems, and later it was modified to work with other applications.
To simplify the communication interface this unit is designed to emulate a COM port in the host terminal. Because of this feature, this module can work with many systems without having any additional device driver(s).
To extend the scope of this unit, it also comes with an option to switch between “direct mode” and “API mode”. In “direct mode” application or host device can directly send characters to the display unit over the emulated serial communication channel.
USB 10-digit Seven Segment Display Module – [Link]
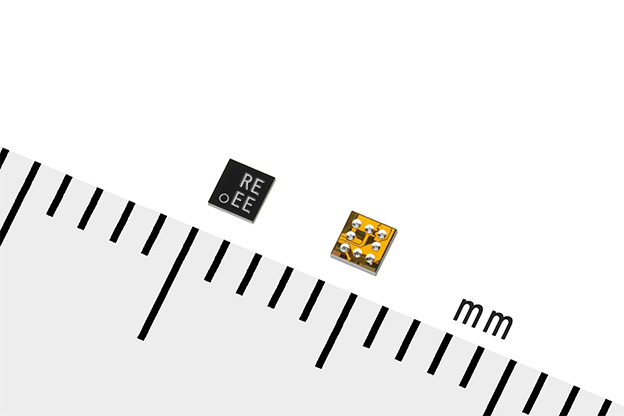
Ricoh Electronic Devices launched RP516 and RP517 series, buck (step-down) DC/DC converters featuring ultra-low output voltage (0.3 V to 1.2 V) and ultra-low quiescent current (typically 0.3 µA). The new converters are designed for IoT systems.
As the IoT market expands, IoT devices with sensors, MCUs, communication ICs, etc. are required to correspond to low voltage to prolong the operating time of the battery. The RP516/RP517 achieve a low output voltage range of 0.3 V to 1.2 V configurable in 0.1 V step, an input voltage range of 1.8 V to 5.5 V, and ultra-low quiescent current of 0.3 µA.
The new RP516/RP517 will facilitate customers to construct IoT devices with low operating voltage and long operating time. Output currents of RP516/RP517 are 100 mA and 300 mA respectively.
The new ICs adopt WLCSP-8-P1, enabling high-density mounting. Additionally, we are developing DFN(PLP)2527-10 (Samples in July 2019) and SOT-89-5 (Samples in September 2019) versions in order to meet various requirements.
Product Features of RP516/ RP517
The RP516/RP517 are DC/DC converters achieving ultra-low output voltage and ultra-low quiescent current, suitable for IoT devices.
Ultra-low Output Voltage Range:
The output voltage range is configurable from 0.3 V to 1.2 V in 0.1 V step.
Ultra-low Quiescent Current:
The ultra-low quiescent current of typically 0.3 µA prolongs the operating time of IoT devices.
Wide Input Voltage Range:
The wide input voltage range of 1.8 V to 5.5 V enables the RP516/RP517 to correspond to various batteries such as coin-shaped batteries, next-generation rechargeable batteries, capacitors, etc. In addition, the input voltage as low as 1.8 V prolongs the operating time of the battery.
Small Packages and Space-saving Mounting:
The new ICs adopt WLCSP-8-P1 (1.45×1.48×0.4 (max) mm). The small package will contribute to reducing the mounting area. Also, DFN(PLP)2527-10 (2.50×2.70×0.6 (max) mm) and SOT-89-5 versions are under development. The new ICs will become available in various applications.
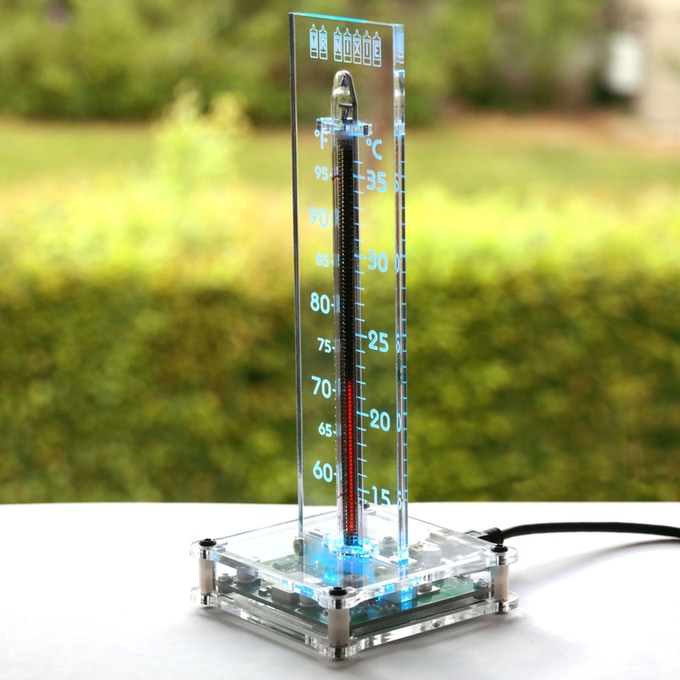
NixieTherm RGB, an IN-13 tube indoor thermometer (DIY kit or assembled) with build-in true RGB controller; powered by 5V USB
A Russian Bargraph-Nixie-tube shows similar like in the good old time a mercury thermometer the room-temperature with a variable glow hight lenght; however with NixieTherm RGB you have a wonderful red-orange glow. At the same time six high quality 3528 SMD-LEDs, together with a true RGB controller with selectable colour pattern, give a never ending play of million different colours.
The project is live on kickstarter and has 10 days to go.
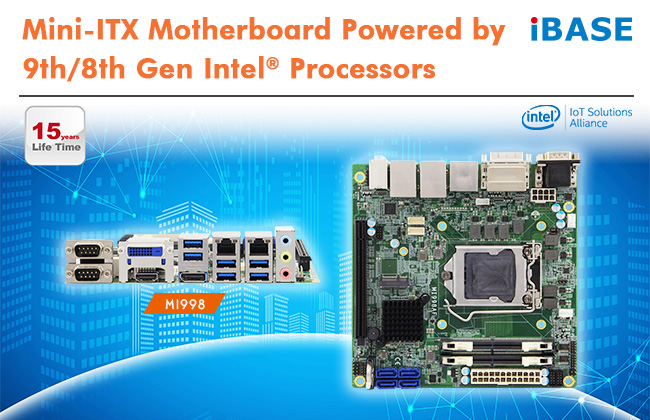
iBASE Technology, a manufacturer of application specific industrial embedded computing platforms, has released the MI998 Mini-ITX motherboard supporting 9th/8th Gen Intel® Xeon® E / Core™ / Pentium® / Celeron® processors with a maximum of 4.7GHz frequency with Intel® Turbo Boost Technology. Equipped with the Intel C246/Q370/H310 chipset, this cutting-edge platform offers the required trusted performance and meets the growing and changing demands in a range of applications, including entry servers for small business, factory automation, cloud services, mobile workstations, and edge computing.
To address customer solutions needs in connectivity, the MI998 provides excellent display flexibility with onboard HDMI, DV-D, DisplayPort and 24-bit dual channel LVDS or eDP interface for three independent displays, as well as two Intel Gigabit Ethernet controllers. Multiple I/O and expansion options includes six USB 3.0, two USB 2.0, four COM, four SATA III, one PCI-E and two M.2 slots. Two DDR4 SO-DIMM sockets on board allow up to 32GB of system memory allocation. Measuring 170mm x 170mm, the MI998 Mini-ITX motherboard also supports Trusted Platform Module (TPM ) 2.0, a watchdog timer and digital I/O.
“We are pleased to announce our MI998 that continues to feature IBASE’s excellent design capability and product quality,” said Wilson Lin, Director of IBASE Product Planning Department.” This latest addition offers our customers flexibility in performance, storage device support and remote manageability for today’s embedded applications”.
MI998 FEATURES:
9th/8th Gen Intel® Xeon® E / Core™ / Pentium® / Celeron® processors, up to 4.7GHz
2x DDR4 SO-DIMM, Max. 32GB, ECC compatible
Intel® Processor integrated graphics, supports DVI-D, HDMI, DisplayPort and 24-bit dual channel LVDS or eDP
Dual Intel® Gigabit LAN
6x USB 3.0, 2x USB 2.0, 4x COM, 4x SATAIII
1x PCI-E (x16), 2x M.2
Watchdog timer, Digital I/O, iAMT (11.6), TPM (2.0)
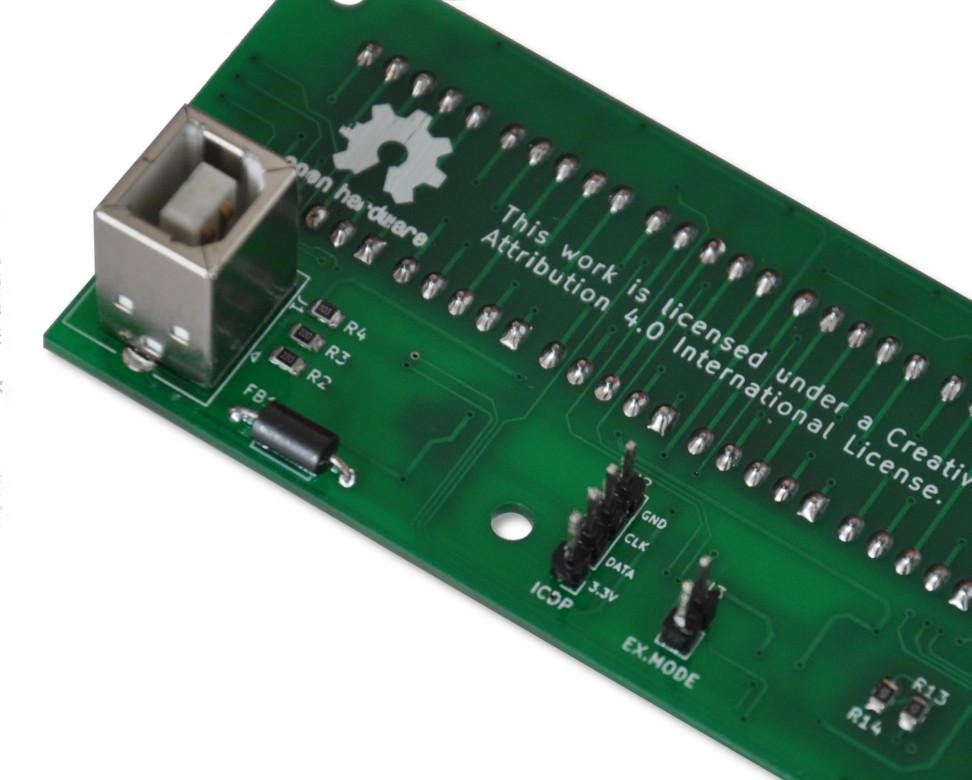
This project is about an open-source, USB based, 10 digit seven segment display unit. This unit is specifically designed to work with POS systems and banking applications. Initially, this system is developed to work with PC based POS systems, and later it was modified to work with other applications.
To simplify the communication interface this unit is designed to emulate a COM port in the host terminal. Because of this feature, this module can work with many systems without having any additional device driver(s).
To extend the scope of this unit, it also comes with an option to switch between “direct mode” and “API mode”. In “direct mode” application or host device can directly send characters to the display unit over the emulated serial communication channel.
Fig.1 – Mode selection jumper.
The “API mode” is intended to provide more extensive features with this unit. All the “API mode” functionalities of this display module are described in the API documentation at github.com. To simplify the API mode development a Python API is also available for this module. This library works with Python 3.6 or newer versions and it supports many operating systems, including Linux, Windows, and Mac.
To install the Python library use the following command:
pip install external-counter-dilshan
The latest version of this library also available at the GitHub repository and it can also clone from the repository.
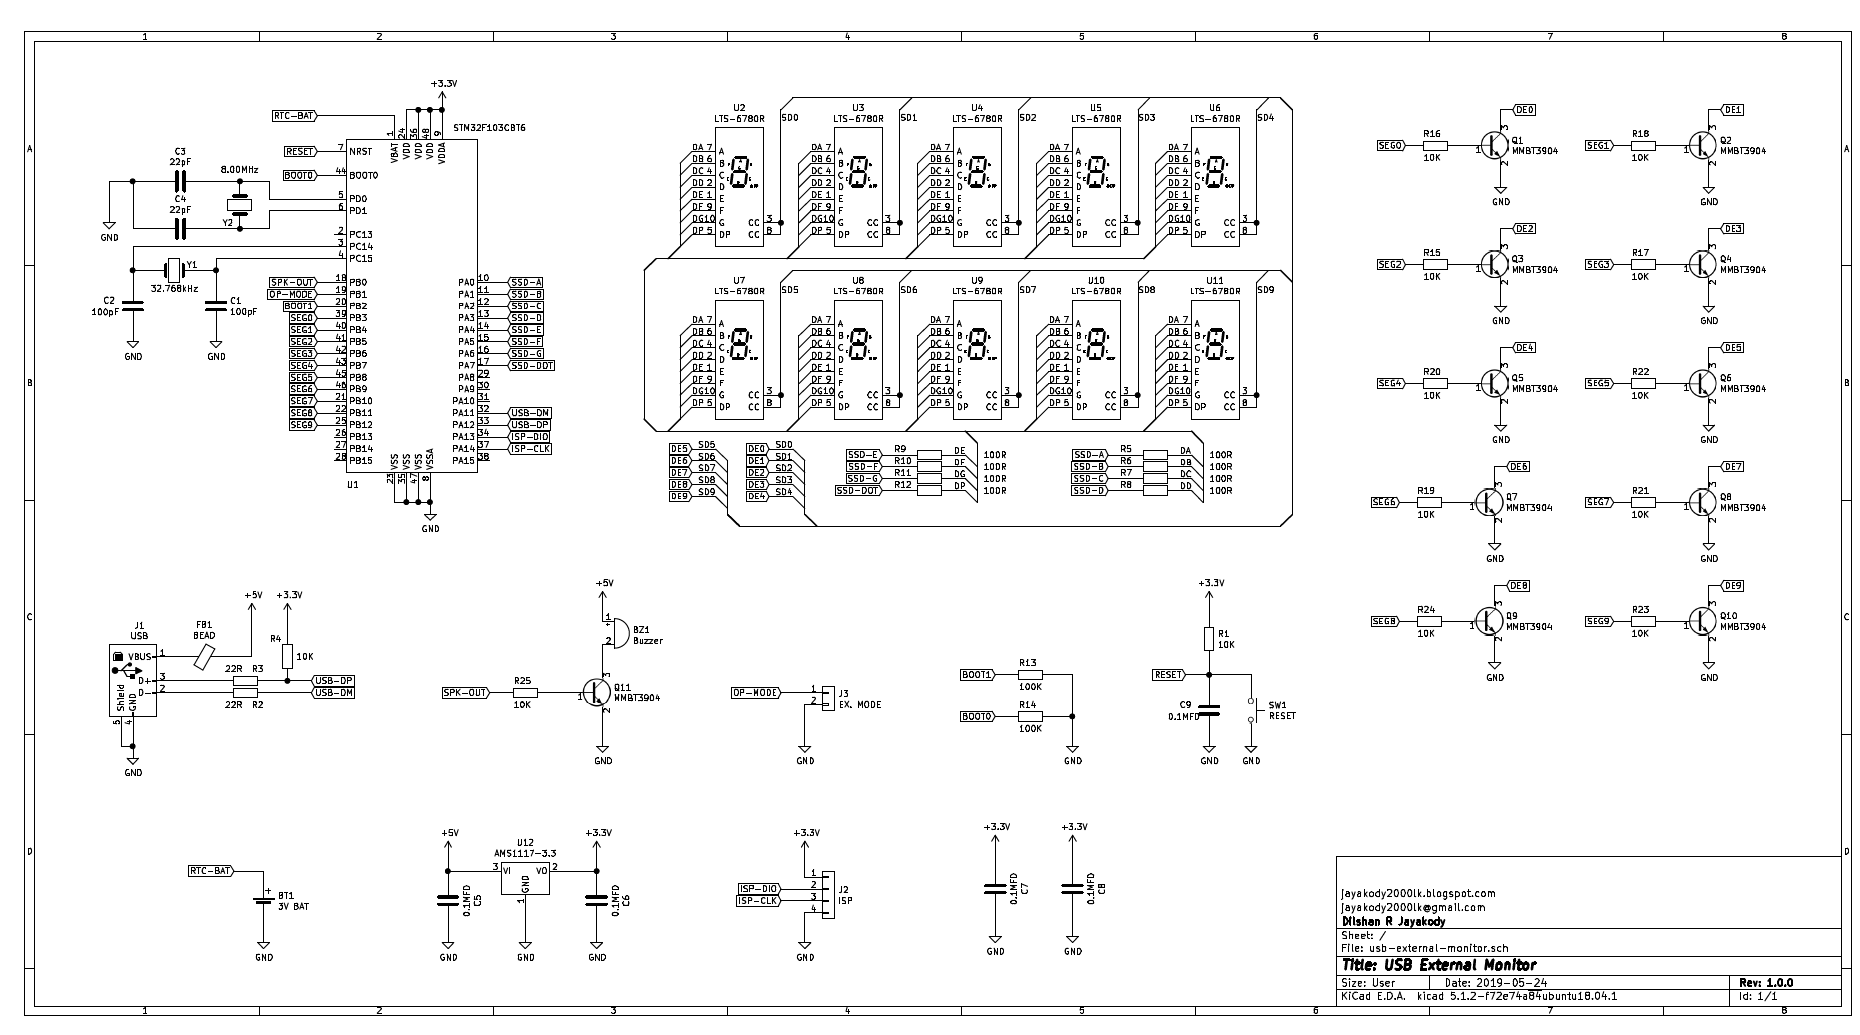
Schematic
This USB external display unit is designed around STM32F103CB MCU. The firmware of this display unit operates with most of the STM32F103 series MCUs, which including STM32 Blue Pill board.
The dimensions of the PCB is 100mm x 100mm and designed as a two-layer board. To overcome the PCB manufacturing cost, we employ many surface-mounted components into the design.
To demonstrate the functionality of this module a simple OrangePi Zero based clock project is available at github.com/dilshan/simple-ntp-clock.
Fig.2 – NTP clock using display module and Orange Pi Zero.
This module is an open-source hardware project. All it’s source codes and design files are available at github.com.
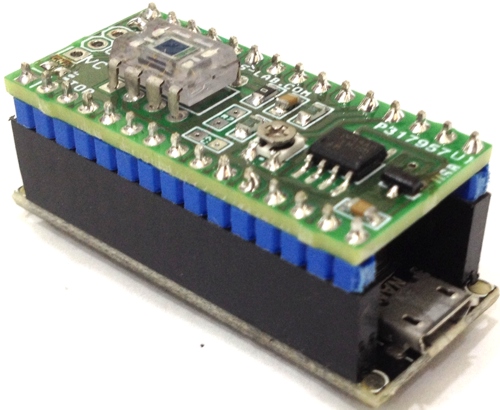
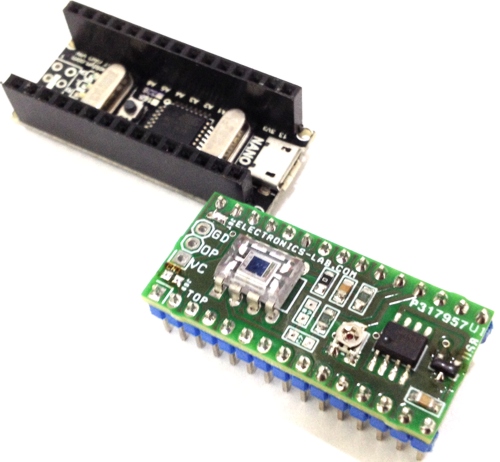
Microchip / Atmel SAMD21 Arm Cortex-M0+ microcontroller has been around for several years and we have wrote for many boards using this microcontroller including the SAMD21 Lora Board and Minimal ATSAMD21 Board. Now, another SAMD21 development board has been shown up on Electrodragon website: the SAMD21 Mini Development Board which is sold for $14.50 on the website, but you can find it cheaper on Aliexpress.
Specifications:
MCU – Microchip ATSAMD21G18 Arm Cortex-M0+ microcontroller @ 48 MHz with 32KB data RAM, 256KB flash
USB – 1x micro USB port for power and programming
Expansion
2x 14-pin headers with 19x digital I/O (including 12x PWM), 6x Analog I/O
3.3V logic level
Programming – 6-pin ISCP connector
Misc – Power, Tx and Rx LED’s, button
Power Supply
Input – 5V via micro USB port or VIN
Output – 3.3V-800mA (However, it reads 3.3V/180mA on the silkscreen)
Consumption – 3.3V @ 220mA
Dimensions – 56.5 x 18 mm
Temperature Range – -40°С – +85°С
Both Wemos D1 SAMD21 M0 Mini and RobotDyn SAMD21 Mini boards appear to be identical except for the branding on the bottom of the board. There’s not a lot of documentation made available from any of the sellers but luckily, BLavery tested the board late last year and documented his experience with Arduino and CircuitPython on Github.