Over the past few weeks, we worked on different projects around IoT. Today, we will continue on this track and we will build a web-based data logger using the Raspberry Pi 3 and the Pi Sense Hat.
For this project, we will designate the Raspberry Pi to measure temperature, humidity and barometric pressure using the Pi Sense Hat and send the data (at 10-minute intervals) via WiFi to an online webserver, which stores the data in a MySQL database and displays them using a simple table on a webpage. The data will be online on a live webpage which means, it can be viewed from anywhere around the world.
Raspberry Pi Web-Based Data logger using MySQL and PHP – [Link]
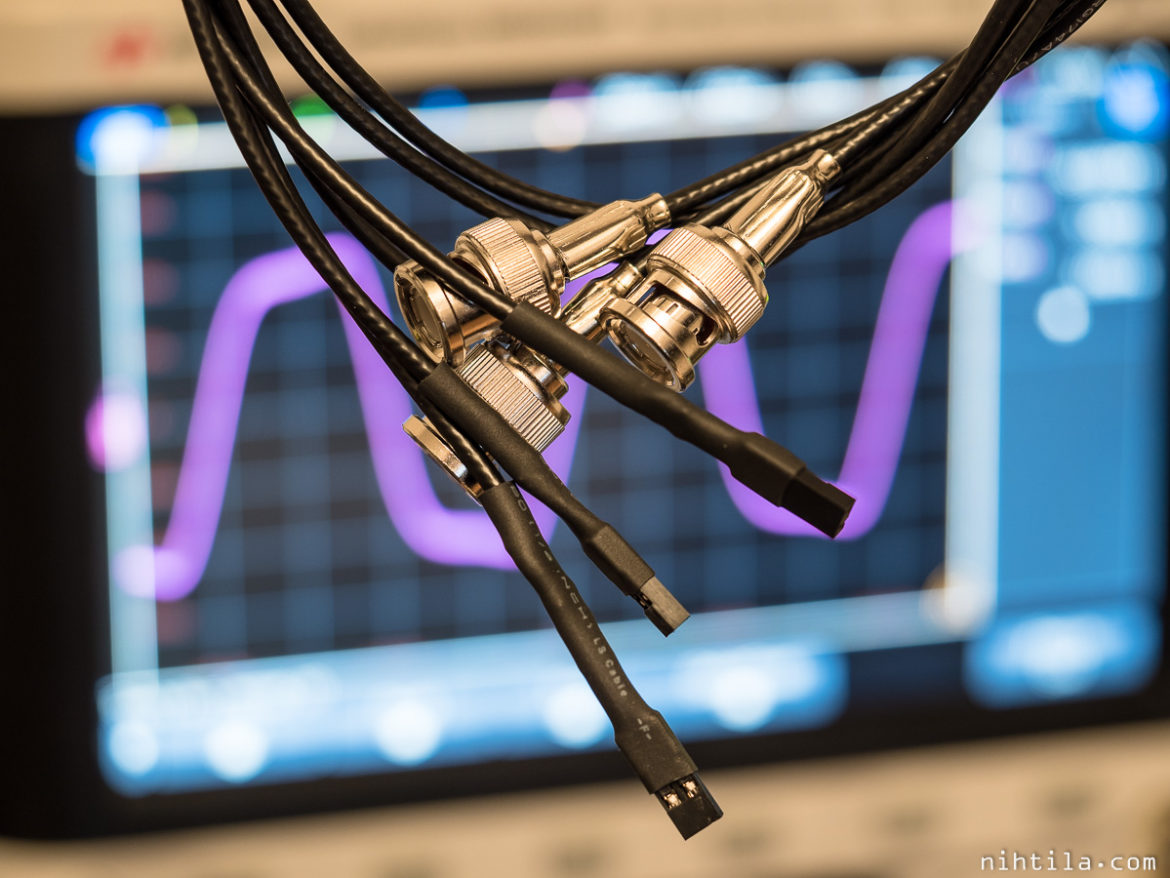
Tomi Nihtilä build his own high-bandwidth passive probes to solve some issues with classic oscilloscope probes he describes on the article. He writes:
Before presenting this great tip I must admit I did not come up with this idea. This type of measurement probe is presented in the book High Speed Digital Design – A Handbook of Black Magic by Howard W. Johnson and Martin Graham. I first saw the idea written by fellow DIYer Janne Ahonen but he also gives credit to Howard Johnson. Please refer to Janne’s article for more technical explanation of the probe, followed by measurements.
Here are instructions how to build and use these probes along with plenty of photos. There are no measurements done to present for now.
Over the past few weeks, we worked on different projects around IoT. Today, we will continue on this track and we will build a web-based data logger using the Raspberry Pi 3 and the Pi Sense Hat.
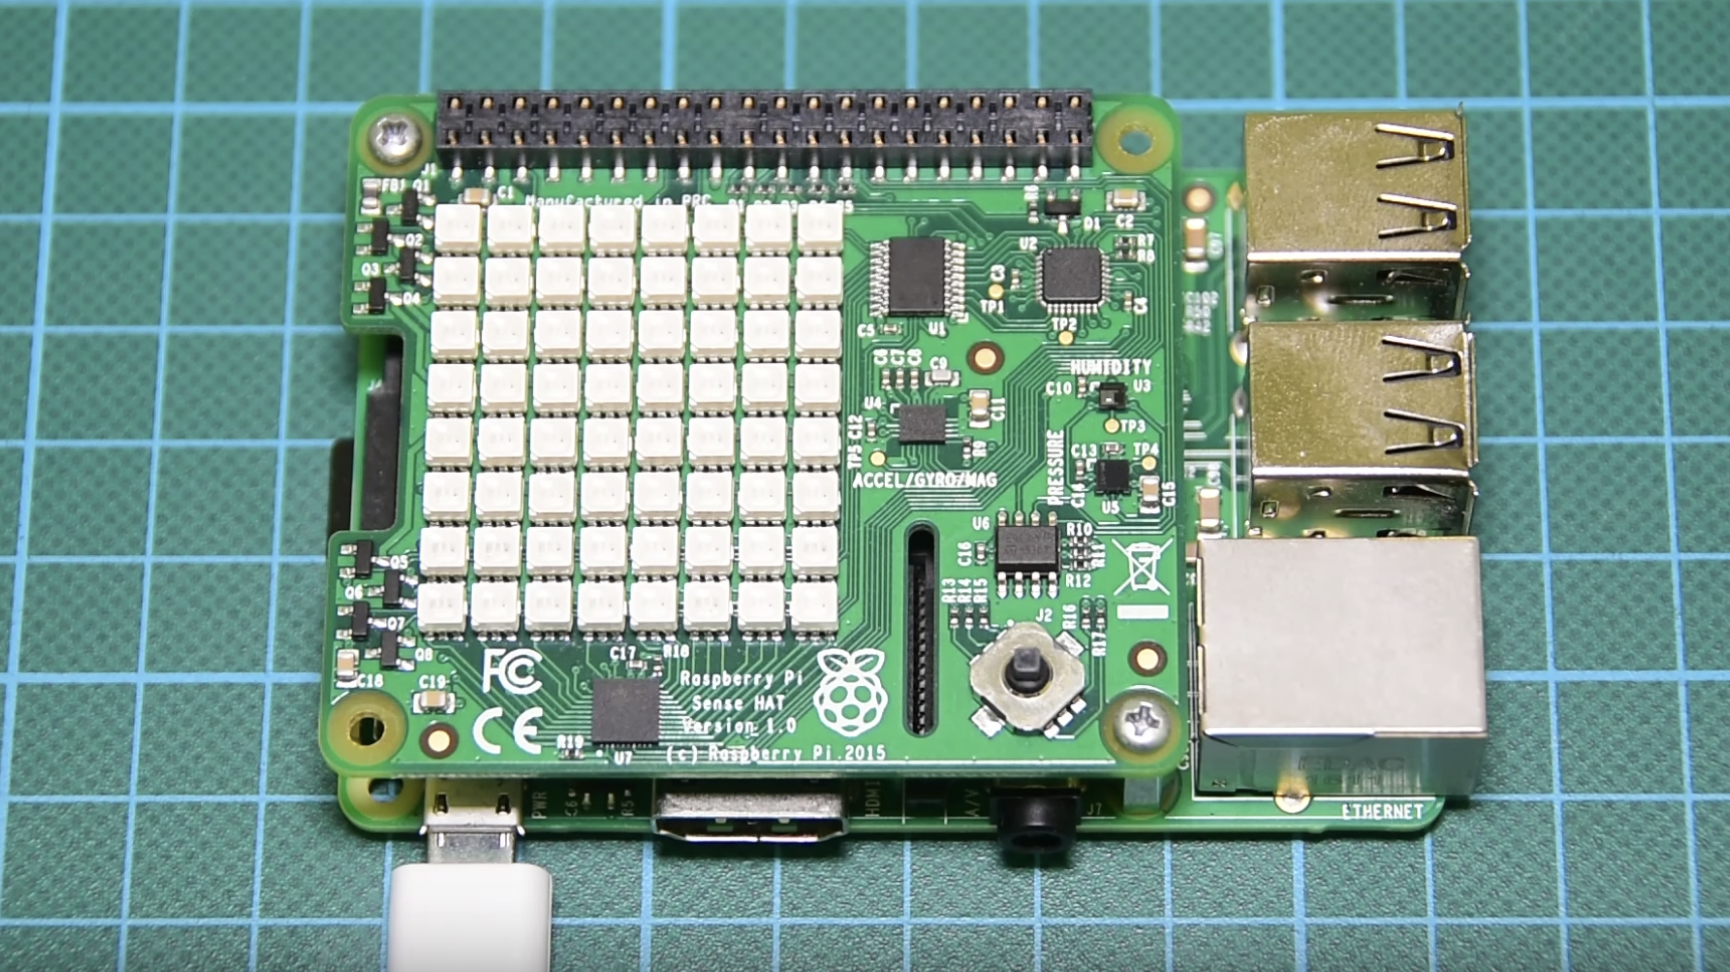
Pi Sense Hat
For this project, we will designate the Raspberry Pi to measure temperature, humidity and barometric pressure using the Pi Sense Hat and send the data (at 10-minute intervals) via WiFi to an online webserver, which stores the data in a MySQL database and displays them using a simple table on a webpage. The data will be online on a live webpage which means, it can be viewed from anywhere around the world.
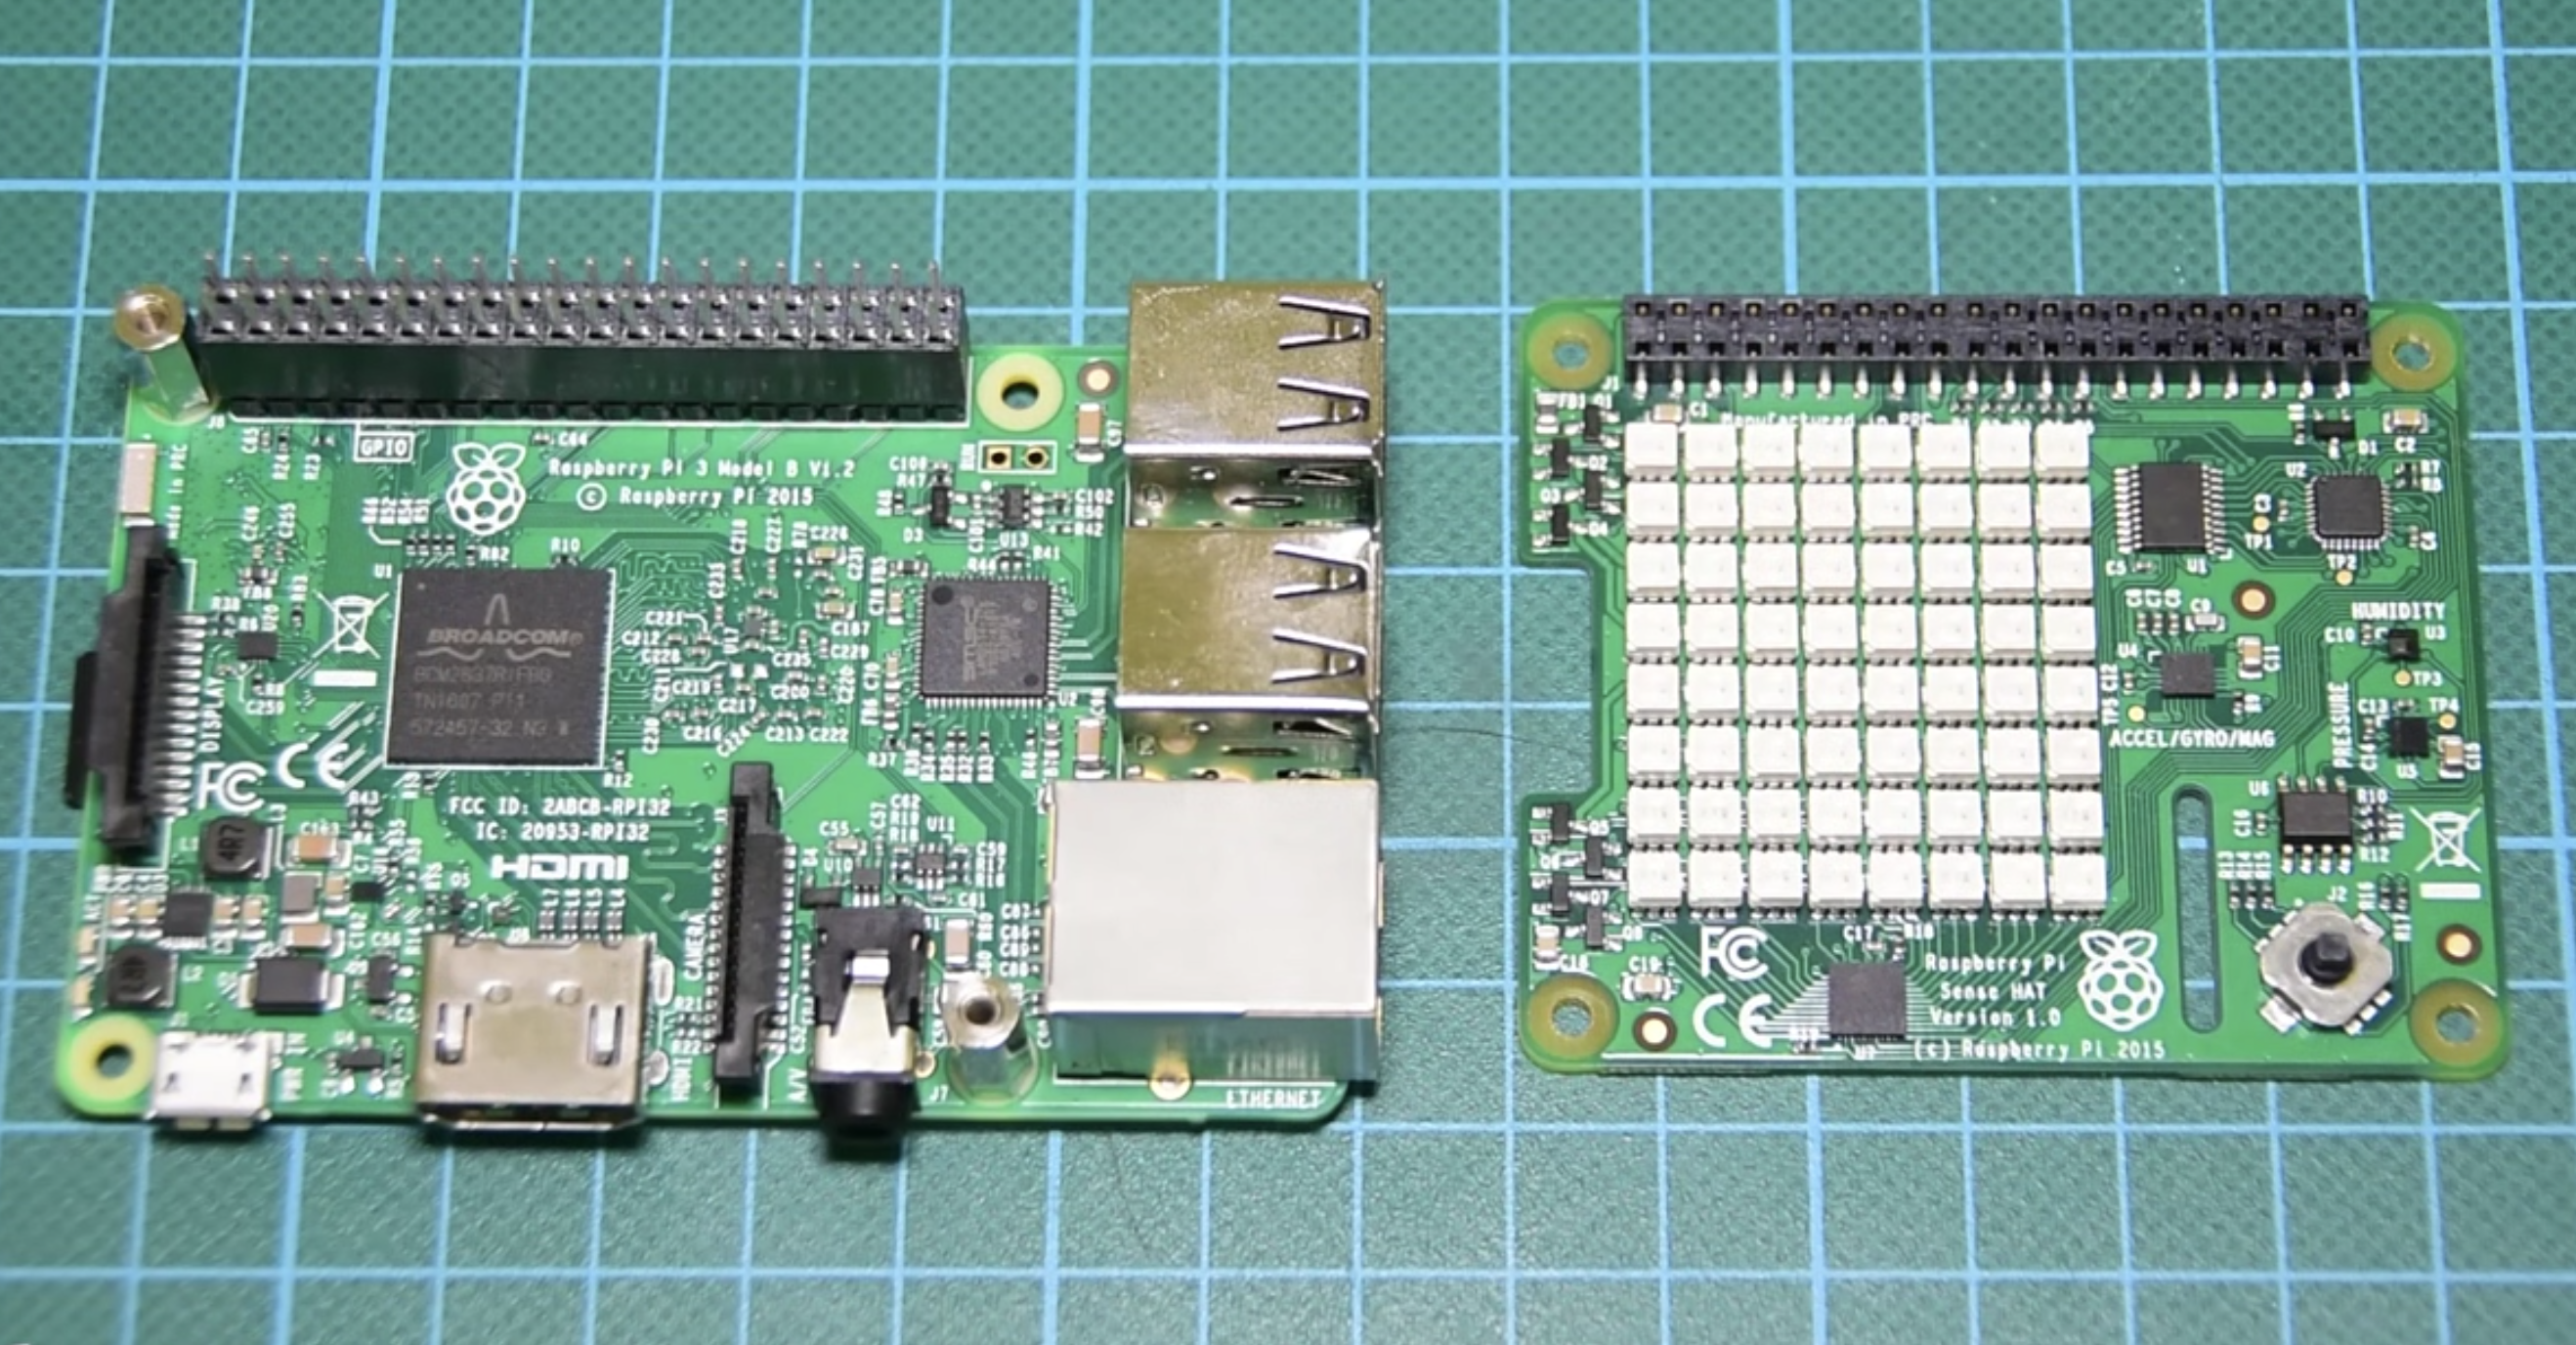
Raspberry Pi 3 and the Sense Hat
At the heart of today’s project is the Raspberry Pi 3 and raspberry Pi Sense Hat. The Sense Hat is an add-on board for the Raspberry Pi, which has many sensors, including a temperature sensor, a humidity sensor, a barometric pressure sensor (all of which will be used for today’s tutorial) among others. The Sense hat makes it easy to use all of these sensors without the stress and errors associated with wiring them. All of the sensors have been routed to pins which connect to the Raspberry Pi GPIO and by using the sense hat Python library, we can easily use simple commands to obtain data from the sensors on the board.
At the end of today’s tutorial, you would know all that is needed to upload data from the Raspberry Pi to a remote webserver.
Required Components
The following components are required to build this project;
In addition to the components mentioned above, we will also need a hosting account to host the web server and database at which data will be stored. For this purpose, you can use any web hosting platform you desire but I will recommend Bluehost as I have been using them for a number of years.
As usual, the specific components used for this tutorial can be purchased via the attached links.
Schematics
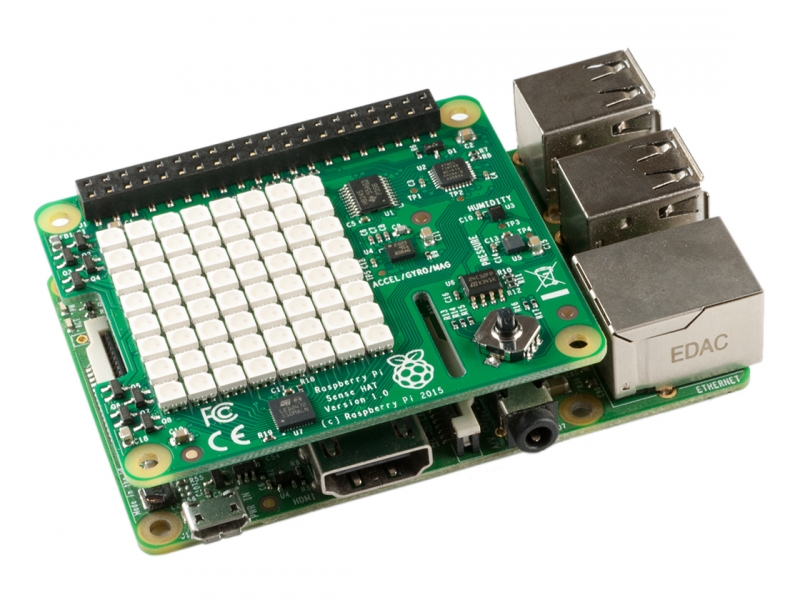
As mentioned during the introduction, the main components for today’s tutorial include the Raspberry Pi and the Sensehat. The Sensehat comes as a shield and thus directly plugs on the Raspberry Pi. Thus, we do not need a schematic, just ensure you plug the Sensehat on the Pi as shown in the image below.
Mount Sense Hat on Raspberry Pi
An alternative to the Sensehat could be to buy sensors to measure each of the parameters to be monitored but using the Sensehat reduces the complexity of the project, reduces the number of wires around and helps make the system compact for easy packaging.
Code
The code of the project consists of two parts; The Python script which will run on the Raspberry Pi, and the group of PHP scripts which will run on the web server. We will take a look at both codes and I will do a brief explanation of what the important part of the codes are doing, starting with the PHP Script for the server.
Before reviewing the server code, its obvious that you need to ensure you have an active hosting account which will host our code. Bluehost mentioned above offer both free and paid accounts which go for around $4 monthly.
To jump to the server side of the project, we start by creating the MySQL database to store all the data. The process of creating a database is quite long so it won’t be covered in this tutorial but there are tons of tutorial around it online. The database is named DATA and it has 5 columns which stand for; Entry ID, date, temperature, humidity and barometric pressure.
There are three important PHP scripts that will run on the server. The first one (named connect.php) is responsible for connecting to the database. It contains the configuration settings for the database including the username, the database password, and the hostname.
The script is short and fairly easy to follow. We start by declaring the doctype and entering the server username, password and hostname into the corresponding variables, then use the mysql_pconnect() function, to connect to the database. The last line of code is used to specify the name of the database to be connected to, which in this case is called “data“. Feel free to change the name as per your database name.
<?php
$MyUsername = "yourDatabaseUsername";  // enter your username for mysql
$MyPassword = "yourFatabasePassword";  // enter your password for mysql
$MyHostname = "localhost";      // this is usually "localhost" unless your database resides on a different server

$dbh = mysql_pconnect($MyHostname , $MyUsername, $MyPassword);
$selected = mysql_select_db("yourDatabaseName",$dbh); //Enter your database name here
?>
The next PHP file is the add_data.php file. This is the script which the Raspberry Pi will send the data that needs to be stored. The script connects to the MySQL database (using the connect.php script) and stores data in the database.
Like the previous script, we start by declaring the doctype as PHP after which we include the connect.php file we created earlier.
<?php
    // Connect to MySQL
    include("connect.php");
Next, we set the default time zone, along with the date and call the time() function to provide a time stamp with the accurate time and date of the data to be logged.
Next, we create a query and use “INSERT INTO” command to obtain the data from the Raspberry Pi and make ready to be stored in the database. With this done, the mysql_query() function is then called and the data stored.
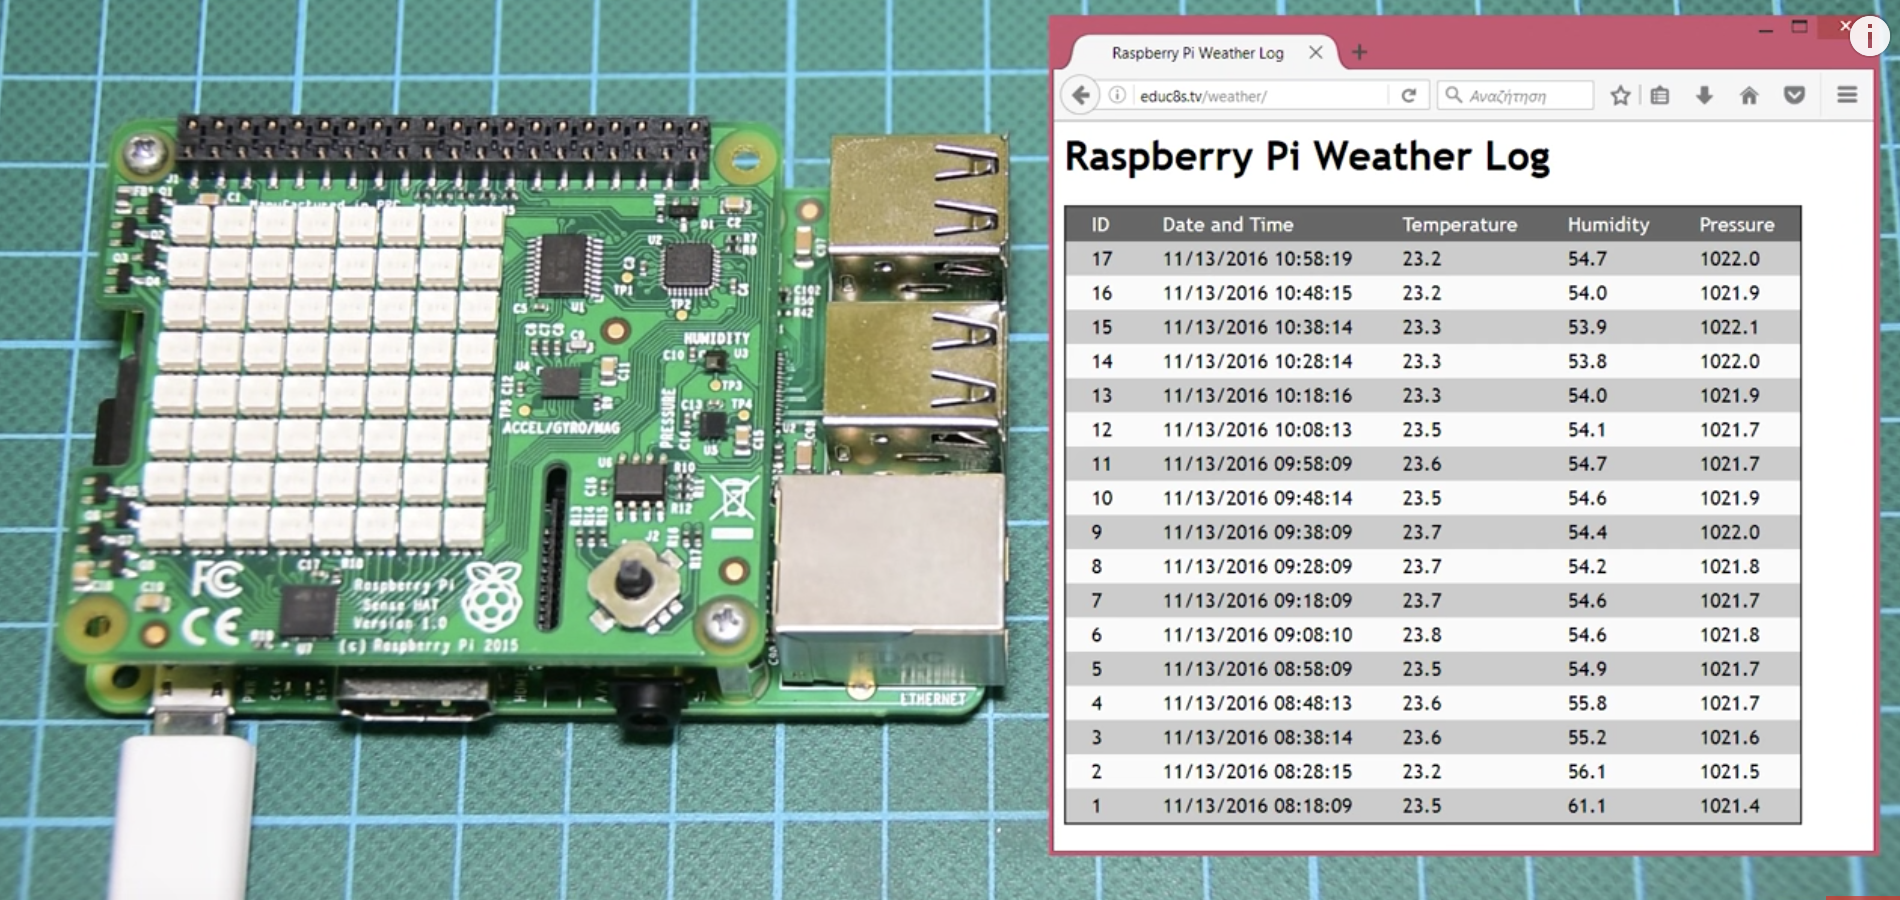
Lastly, is the index.php file. This represents the main web page where all the stored information is displayed. The index.php script connects to the database (also using the connect.php script), obtain the stored data, and display them in an HTML formatted table.
For the index.php script, we start with the same lines similar to the others. We indicate the doctype and include the connect.php file.
<?php
    // Start MySQL Connection
    include('connect.php');


?>
Next, we write the HTML code to create the table which will be displayed on the webpage. Few lines of CSS were also added to give it a nice look.
Next, we write the concluding PHP script to fetch data from the database and fill to the table created above.
<?php


    // Retrieve all records and display them
    $result = mysql_query("SELECT * FROM data ORDER BY id DESC");

    // Used for row color toggle
    $oddrow = true;

    // process every record
    while( $row = mysql_fetch_array($result) )
    {
        if ($oddrow)
        {
            $css_class=' class="table_cells_odd"';
        }
        else
        {
            $css_class=' class="table_cells_even"';
        }

        $oddrow = !$oddrow;

        echo '<tr>';
        echo '   <td'.$css_class.'>'.$row["id"].'</td>';
        echo '   <td'.$css_class.'>'.$row["date"].'</td>';
        echo '   <td'.$css_class.'>'.$row["temperature"].'</td>';
        echo '   <td'.$css_class.'>'.$row["humidity"].'</td>';
        echo '   <td'.$css_class.'>'.$row["pressure"].'</td>';
        echo '</tr>';
    }
?>
The complete code for each of the PHP files is attached in the file under the download section.
With the server files written, it is time to write the Python file which will run on the Raspberry Pi. The function of this script is simply to obtain temperature, humidity and barometric pressure from the Sense Hat and send that data to the server.
For the Python code, we will use the urllib2 library, the sensehat library, and the OS library. The OS library and the urllib2 may already come installed depending on your python distro. If they don’t, you need to install them alongside the sense hat python library too.
To do a short explanation of the code; we start by importing all of the libraries that we will use for the project (all mentioned above), after which we create an instance of the sensehat library and store in the variable sense.
import os
import threading
import urllib2
from sense_hat import SenseHat


sense = SenseHat()
Next, we create the readsensor() function.
We start by declaring and initializing variables to hold corresponding information. Ensure the variables are declared global so that other functions can access them.
def readSensor():

  global temperature
  global humidity
  global pressure
  global cpu_temp

  cpu_temp = 0
  temperature =0
  humidity = 0
  pressure = 0
Next, we read the temperature, pressure and humidity values using the corresponding functions, storing them in the appropriate variable and round the numbers.
This function reads the CPU temperature of Raspberry pi and subtracts it from the temperature readings from the Sensehat sensor. This is done to improve the accuracy of the readings as the temperature from the Sensehat is usually affected by the temperature of the Raspberry Pi because it is directly mounted on it.
ef readCPUTemperature():
global temperature
cpu_temp = os.popen("/opt/vc/bin/vcgencmd measure_temp").read()
cpu_temp = cpu_temp[:-3]
cpu_temp = cpu_temp[5:]
temperature = sense.get_temperature()
print(cpu_temp)
if cpu_temp == "42.9":
temperature = temperature - 8.2
elif cpu_temp == "44.0":
temperature = temperature - 8.5
elif cpu_temp == "44.5":
temperature = temperature - 8.7
elif cpu_temp == "45.1":
temperature = temperature - 9.0
elif cpu_temp == "46.7":
temperature = temperature - 9.1
elif cpu_temp == "47.2":
temperature = temperature - 9.2
elif cpu_temp == "47.8":
temperature = temperature - 9.3
elif cpu_temp == "48.3":
temperature = temperature - 9.35
elif cpu_temp == "48.9":
temperature = temperature - 9.4
else:
temperature = temperature - 9.5
Next, we have the sendDataToServer() function.
This function uses threading to obtain the temperature, humidity and pressure data, displays it, and merges it with URL string to be sent to the server.
def sendDataToServer():
global temperature
global pressure
global humidity
threading.Timer(600,sendDataToServer).start()
print("Sensing...")
readSensor()
readCPUTemperature()
temperature = round(temperature,1)
print(temperature)
print(humidity)
print(pressure)
temp= "%.1f" %temperature
hum ="%.1f" %humidity
press = "%.1f" %pressure
urllib2.urlopen("http://www.educ8s.tv/weather/add_data.php?temp="+temp+"&hum="+hum+"&pr="+press).read()
Lastly, the sendDataToServer function is called within the main code.
sendDataToServer()
The complete code for the Python script is available below and also attached under the download section.
import os
import threading
import urllib2
from sense_hat import SenseHat
sense = SenseHat()
def readSensor():
global temperature
global humidity
global pressure
global cpu_temp
cpu_temp = 0
temperature =0
humidity = 0
pressure = 0
temperature = sense.get_temperature()
  humidity = sense.get_humidity()+16.5
  pressure = sense.get_pressure()+20

  if pressure == 20 :
    pressure = sense.get_pressure()+20

  humidity = round(humidity,1)
  pressure = round(pressure,1)
def readCPUTemperature():
global temperature
cpu_temp = os.popen("/opt/vc/bin/vcgencmd measure_temp").read()
cpu_temp = cpu_temp[:-3]
cpu_temp = cpu_temp[5:]
temperature = sense.get_temperature()
print(cpu_temp)
if cpu_temp == "42.9":
temperature = temperature - 8.2
elif cpu_temp == "44.0":
temperature = temperature - 8.5
elif cpu_temp == "44.5":
temperature = temperature - 8.7
elif cpu_temp == "45.1":
temperature = temperature - 9.0
elif cpu_temp == "46.7":
temperature = temperature - 9.1
elif cpu_temp == "47.2":
temperature = temperature - 9.2
elif cpu_temp == "47.8":
temperature = temperature - 9.3
elif cpu_temp == "48.3":
temperature = temperature - 9.35
elif cpu_temp == "48.9":
temperature = temperature - 9.4
else:
temperature = temperature - 9.5
def sendDataToServer():
  global temperature
  global pressure
  global humidity

  threading.Timer(600,sendDataToServer).start()
  print("Sensing...")
  readSensor()
  readCPUTemperature()
  temperature = round(temperature,1)
  print(temperature)
  print(humidity)
  print(pressure)
        temp= "%.1f" %temperature
  hum ="%.1f" %humidity
  press = "%.1f" %pressure
  urllib2.urlopen("http://www.educ8s.tv/weather/add_data.php?temp="+temp+"&hum="+hum+"&pr="+press).read()
sendDataToServer()
Demo
Power on your Pi. Log-in and open the python IDE. Copy the code and paste it in the python editor. By now, you should have uploaded the PHP files to your server and they should be ready to receive the data. As soon as that is confirmed, run the python script. After a while, you should see the data displaying in the table as shown in the image below.
Demo
This is essentially an IoT device and while all we measure for this tutorial is just temperature and humidity, the same procedure can be adopted for several other important applications like health monitoring, and utility management to mention some.
That’s it for this tutorial guys. What will you build? Do reach out to me via the comment section if you have any question.
The video version of this tutorial is available on youtube.
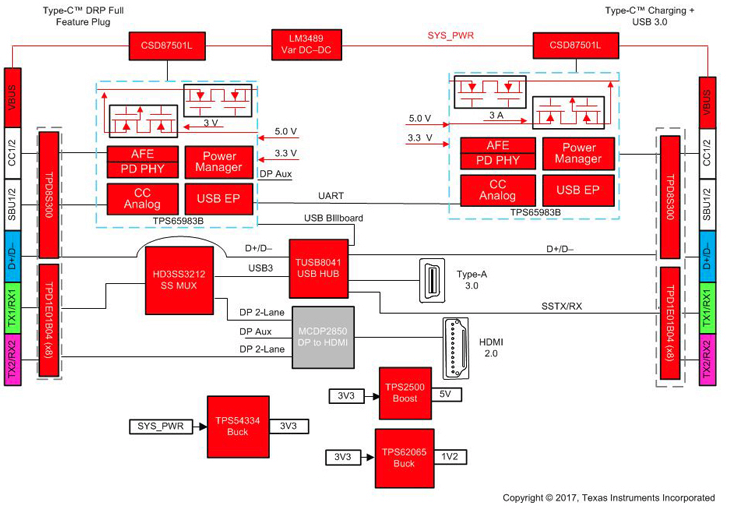
The TIDA-03027 reference design represents a multiport adapter solution that enables products with a USB Type-C interface to connect to HDMI 2.0 and USB 3.0 Type-A interfaces. It also includes an additional USB Type-C full feature receptacle, which allows the user to simultaneously connect USB Type-C chargers (up to 20V / 3A) or devices. This feature set is particularly useful as a peripheral to notebook, tablet, and phone systems with a single USB Type-C interface.
Block Diagram
Features
USB Type-C and power delivery full-feature plug
Bi-directional power (up to 20V/3A)
Video (up to 4K) via HDMI 2.0
USB 3.0 via USB Type-A or USB Type-C
Aardvark connector for debug and flash update
Flash update over USB Type-C via USB 2.0Connections
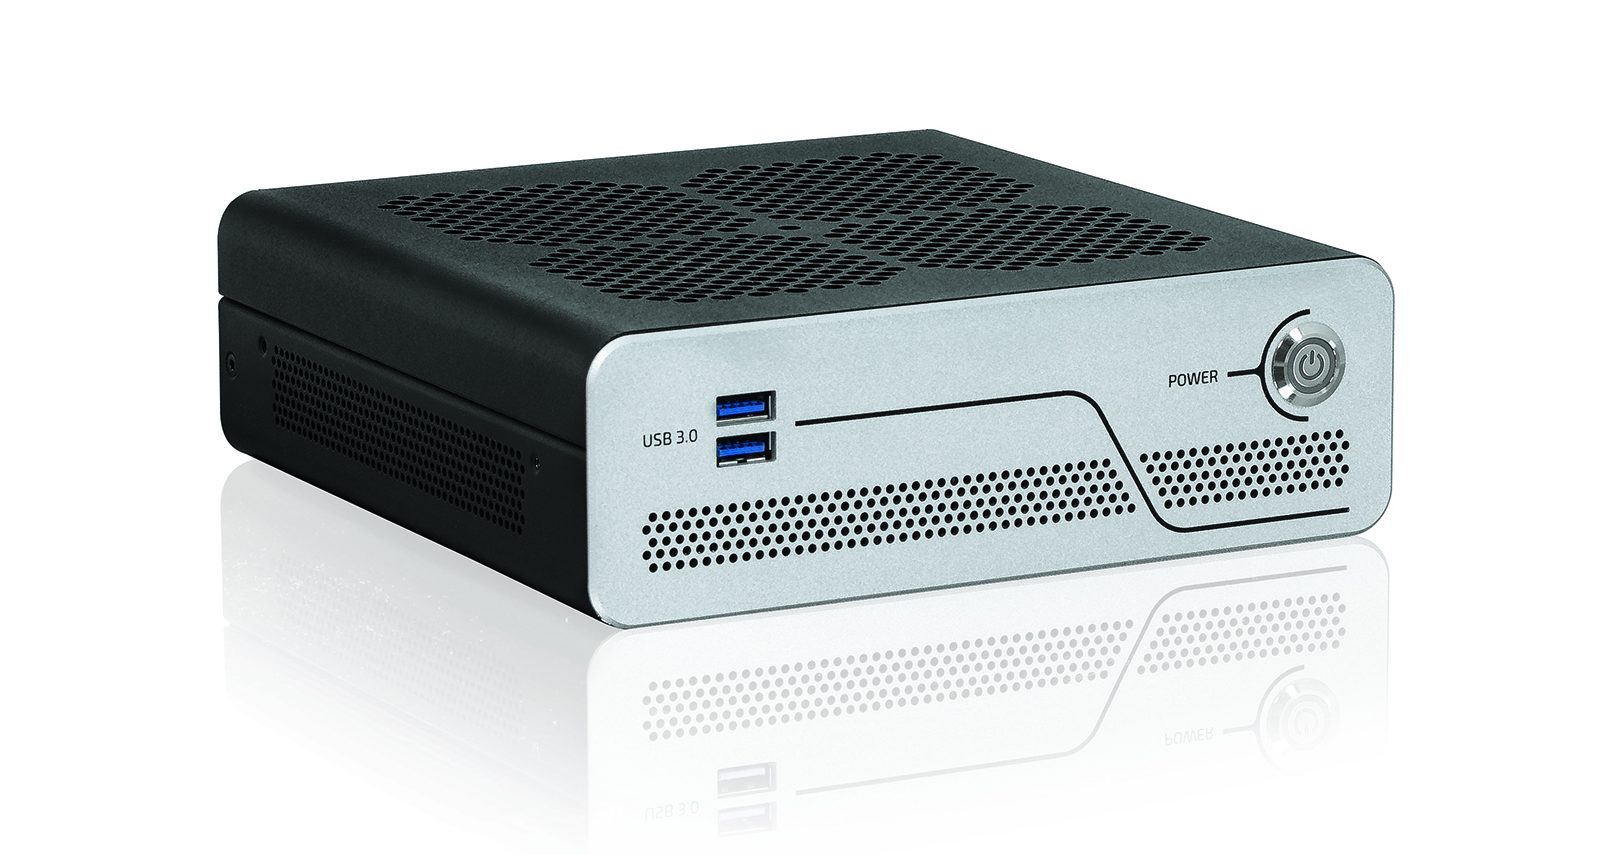
KBox B-201-CFL with Powerful 8th Generation Intel® Core™ i3/i5/i7 Processors – Compact Housing, Low-Noise Operation and Flexible Mounting Options
Kontron, a leading global provider of IoT/Embedded Computing Technology (ECT), introduces the KBox B-201-CFL to its family of embedded box PCs. The KBox B-201-CFL features high performance in a compact housing and with low noise level (maximum 34 dB(A)). Thanks to its 8th Gen Intel® Core™ i3/i5/i7 processors and the Intel® H310 Express chipset, the KBox B-201-CFL is geared towards compute-intensive processes and large amounts of data. This makes it particularly suitable for use in high-end image processing and plant data collection. In addition, the KBox is EN55032 class B-certified, complying with stricter radio interference limits than class A. This makes it ideal not only for use in industrial environments, but also for residential and commercial applications, or in their immediate vicinity. Along with its modern design, this makes the KBox B-201-CFL the ideal computer for architecture and graphics offices as well as music studios. The large number of interfaces, as well as the 2.5 inch SSD, and a fast M.2 SSD provide a wide range of applications.
The core of the KBox B-201-CFL is a motherboard in the Mini-ITX form factor (170×170 mm), and a CPU with up to six processor cores: Depending on the requirements, three 8th Gen Intel® Core™ i3/i5/i7 processors can be selected. Performance is enhanced by the Intel® H310 Express chipset.
Various mounting options guarantee maximum flexibility: Using a VESA mount, the KBox B-201-CFL can be operated directly behind a monitor, or as a desktop PC horizontally or vertically. Special brackets, which also enable horizontal and vertical operation, are available for mounting under the table, on the wall, or in the control cabinet.
The compact housing of the KBox B-201-CFL with the dimensions 190x60x190 mm is made of hot-dip zinc coated mild steel sheet (EN10215) and aluminium. The Box PC can be operated at a temperature range of 0°C to plus 45°C.
The system features a DisplayPort V1.2, which can operate up to four displays as well as a DVI-D connector. Numerous interfaces, such as three USB 2.0, two USB 3.0, and two USB 3.1 Gen 1 ports ensure high flexibility. The existing RS-232 interface can be used, for example, to connect POS terminals and measuring instruments. The Box PC can optionally be equipped with a Mini PCIe plug-in card in half-size format and a M.2 SSD (2260/2242), or a Mini PCIe plug-in card in full-size format in combination with a M.2 SSD (82242). In additon, two Ethernet ports 10/100/1000MBit/s (WoL) are available.
Data storage media for the operating system and data is available through a 2.5 inch SSD SATA III/ SATA-600 removable drive or an internal M.2 SSD (2280, 2260, 2242) slot. The Box PC supports Windows® 10 IoT Enterprise LTSB or Yocto Linux operating systems.
Specifications
High processing capability: 8th Gen Intel® Core™ i7/i5/i3
Small form factor with mITX motherboard
Removable 2,5” SSD
Low noise design, max 34 dB(A)
Various mounting options: desktop, directly behind a monitor, wall, control cabinet etc., likewise horizontal or vertical operation
The KBox B-201-CFL supports TPM V2.0 encryption for secure cloud connection. It optionally supports the Kontron APPROTECT security solution. The integrated security chip from Wibu-Systems in conjunction with a suitable software framework protects IP rights and provides copy and reverse engineering protection. Kontron APPROTECT Licensing also enables new business models such as “pay per use”, demo versions for limited time periods, or activation/deactivation functions.
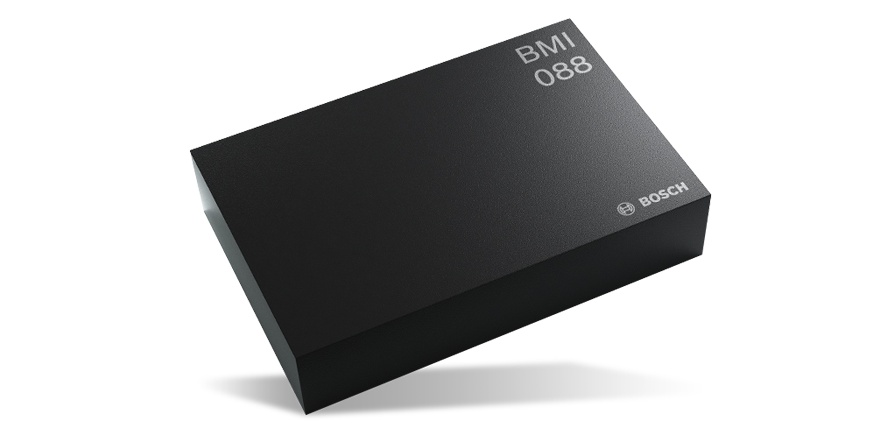
Bosch’s BMI088 features high vibration suppression for drone and robotic applications.
Bosch Sensortec’s BMI088 is a high-performance 6-axis inertial sensor consisting of a 16-bit digital, triaxial, ±24 g accelerometer and a 16-bit digital, triaxial, ±2000°/s gyroscope. BMI088 allows highly accurate measurement of orientation and detection of motion along three orthogonal axes. With high vibration robustness and a small footprint of 3 mm x 4.5 mm x 0.95 mm, BMI088 is unique in the class of high-performance IMUs used in harsh environments, such as those in drones and robotics applications. BMI088 is specifically designed to effectively suppress vibrations that could occur due to resonances on the PCB or the structure of the total system. Apart from high vibration robustness, the excellent temperature stability of BMI088 helps reduce the design effort and costs on a system level.
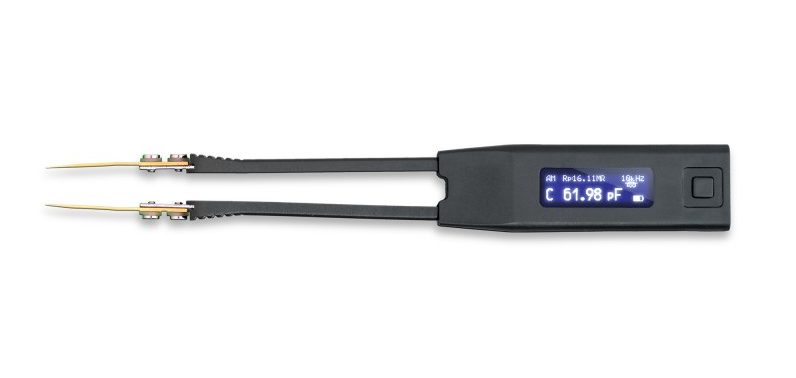
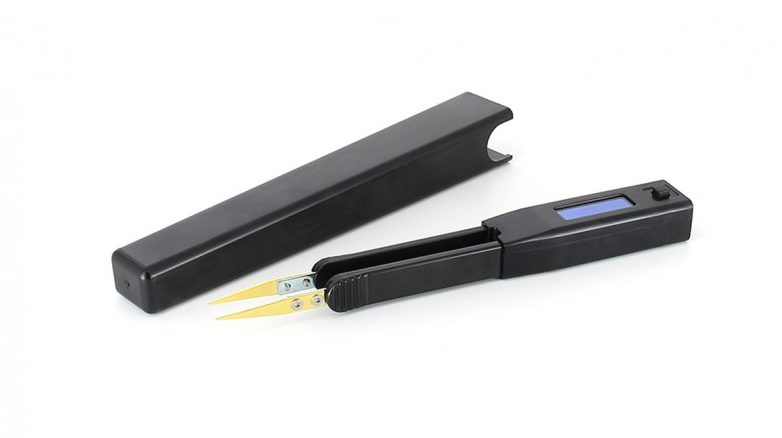
Ideal-Tek’s Smart Tweezers unique design combines ergonomic shielded handles and a precise full featured LCR impedance meter.
Ideal-Tek’s LCR meter Smart Tweezers™ are an updated concept in handheld electronic tools. A unique design combines a pair of gold-plated SMD tweezers with ergonomic shielded handles and a precise full featured LCR impedance meter in a compact, lightweight instrument.
Smart Tweezers™ measure an electronic component’s capacitance, resistance, and inductance with high speed and precision by evaluating circuit impedance. It is a perfect solution for testing and identification of surface mount devices (SMD) as well as for troubleshooting of complex electronic systems.
Available models include the Colibri ST-5S™, ST-5S-BT2 Bluetooth, and the ST-LED Tester.
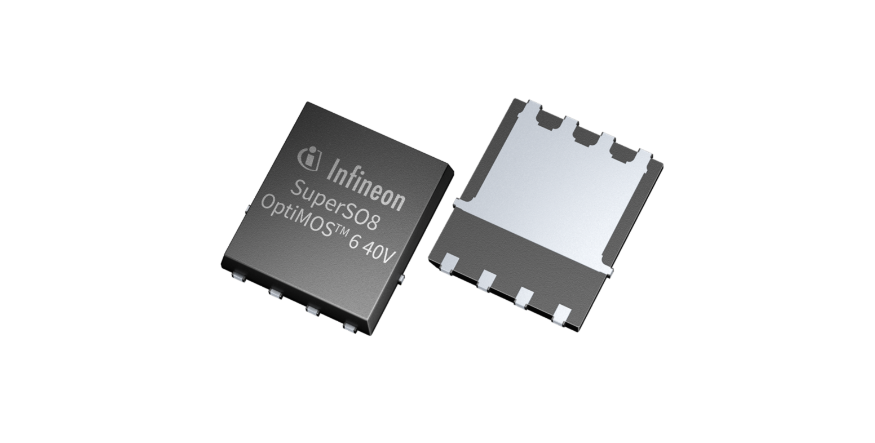
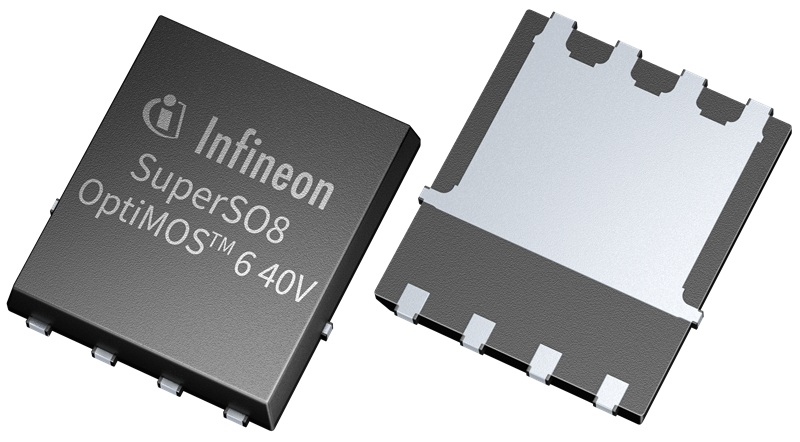
Based on Infineon’s thin wafer technology, a family of 40V MOSFETs are claimed to enable “significant performance benefits” and will cover a wide voltage range.
The OptiMOS 6 family has been optimized for synchronous rectification in switch mode power supplies (SMPS) for servers, desktop PCs, wireless chargers, quick chargers and ORing circuits.
They deliver a 30 per cent reduced on state resistance and improved figure of merits (Q g x R DS(on) down by 29 per cent and Q gd x R DS(on) down by 46 per cent) to meet efficiency in SMPS applications over a wide range of output power, avoiding the trade-off between low and high load conditions, says Infineon.
The efficiency curve clearly shows that OptiMOS 6 outperforms previous generation products at low output power levels due to its superior switching performance. This can be maintained at even higher output levels despite the dominance of R DS(on) losses. As a result, developers profit from easier thermal designs and less paralleling efforts leading to lower system cost.
Two packages are available:
The SuperSO8 measure 5.0 x 6.0mm, with R DS(on) ranging from 5.9 to 0.7 mOhm.
The PQFN option measure 3.0 x 3.0, 3.3 x 3.3mm and has R DS(on) ranging from 6.3 to 1.8 mOhm.
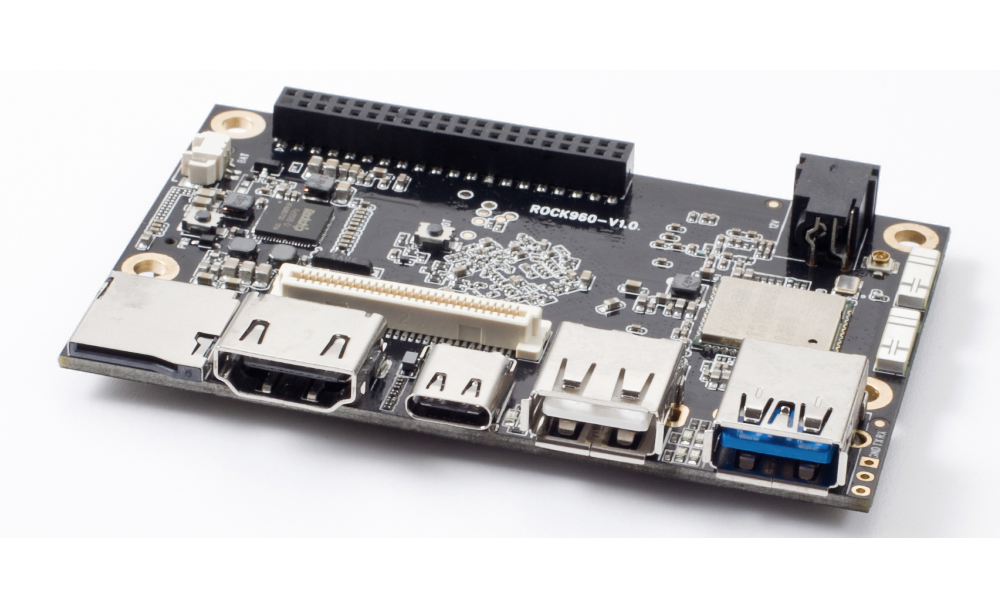
VAMRSLimited launched Rock96 Model C, which retains being part of their 96Boards ecosystem. ROCK960is the first 96boards based on Rockchip processor. Featuring RK3399 with Dual A72 plus Quad A53 cores and Mali T860MP4 makes it one of the most powerful 96boards.
ROCK960 Model C by VAMRS
Here is a brief explanation of 96board ecosystem: 96boards is a range of specifications with boards and peripherals offering different performance levels and features in a standard footprint, cross-vendor, platform-independent, easy to find alternatives, supported by industrial giants. 96Boards mezzanine products expand ROCK960 with new interfaces for IoT, industrial control, and other embedded applications.
The Rock96 Model C comes with the RK3399 SoC, which features a hexacore ARM big.LITTLE processor with 2X Cortex-A72 cores, 4X Cortex-A53 cores, a Mali-T860 GPU, and up to 4Gb of LPDDR4 RAM (depending on the version). It also packs a micro SD card slot (eMMC optional), HDMI 2.0 port, USB-C port (host only), and a pair of USB 3.0 ports (one host only, and one OTG). 4 lanes PCI-E 2.1 on board makes the high-speed communication such as FPGA or external GPU possible.
The new Rock96 Model C still preserves the original Rock96’s 40-pin low-speed GPIO header (UART, SPI, I2C, I2S), 60-pin high-speed header (MIPI DSI, USB, MIPI CSI, HSIC, SDIO), and 4-lane M.2 PCI-E 2.1 connector. Wireless connectivity is done through Wi-Fi 802.11 a/b/g/n/ac and Bluetooth 4.0 Low Energy with a pair of onboard antennas, and two u.FL connectors.
The key specifications are:
Introduction:
96boards Consumer Edition specification Compliant
Preloaded Android 7.1 TV box edition
Processor:
Rockchip RK3399
Dual Cortex-A72, frequency 1.8Ghz with quad Cortex-A53, frequency 1.4Ghz
Mali T860MP4 GPU, supports OpenGL ES 1.1 /2.0 /3.0 /3.1 /3.2, Vulkan 1.0, Open CL 1.1 1.2, DX11.
Storage:
16GB eMMC or 32GB eMMC optional
uSD slot supports up to 128G MicroSD card
Memory: 2GB LPDDR3 or 4GB LPDDR3 optional
Wireless:
802.11 a/b/g/n/ac 2×2 MIMO up to 867Mbps
Bluetooth 4.2
Display:
HDMI 2.0 up to 4k@60DP 1.2 via USB type C port
MIPI DSI 4 lanes via high-speed connector
USB: USB 3.0 type AUSB 3.0 type C with DP 1.2
PCI-E: PCI-E 2.1, M.2 B key connector, hotplug not supported
IO:
40-pin low-speed header :
– 2 x UART
– 1 x SPI bus
– 2 x I2C bus
– 1 x PCM/I2S
– 12 x GPIO
– 2 x 12V DC power in
– 1 x 1.8V power pin
– 1 x 5V power pin
– 4 x ground pins
60-pin high-speed header :
– 1 x four lanes MIPI DSI/CSI
– 1 x four lanes MIPI CSI
– 2 x I2C bus
– 1 x USB 2.0 bus
Battery: RTC battery for time backup(optional)
Power: 8 to 18V DC input12V/2A DC 4.0 adapter default
Size: 85mm x 54mm
Seeed Studio is currently selling only the 1GB version of the Rock96 Model C board for $69, while VAMRS is offering all three boards for $69 (1Gb), $79 (2Gb), and $99 (4Gb), respectively. If you need one (or more) of this awesome board for your next project, go to the VAMRS store.
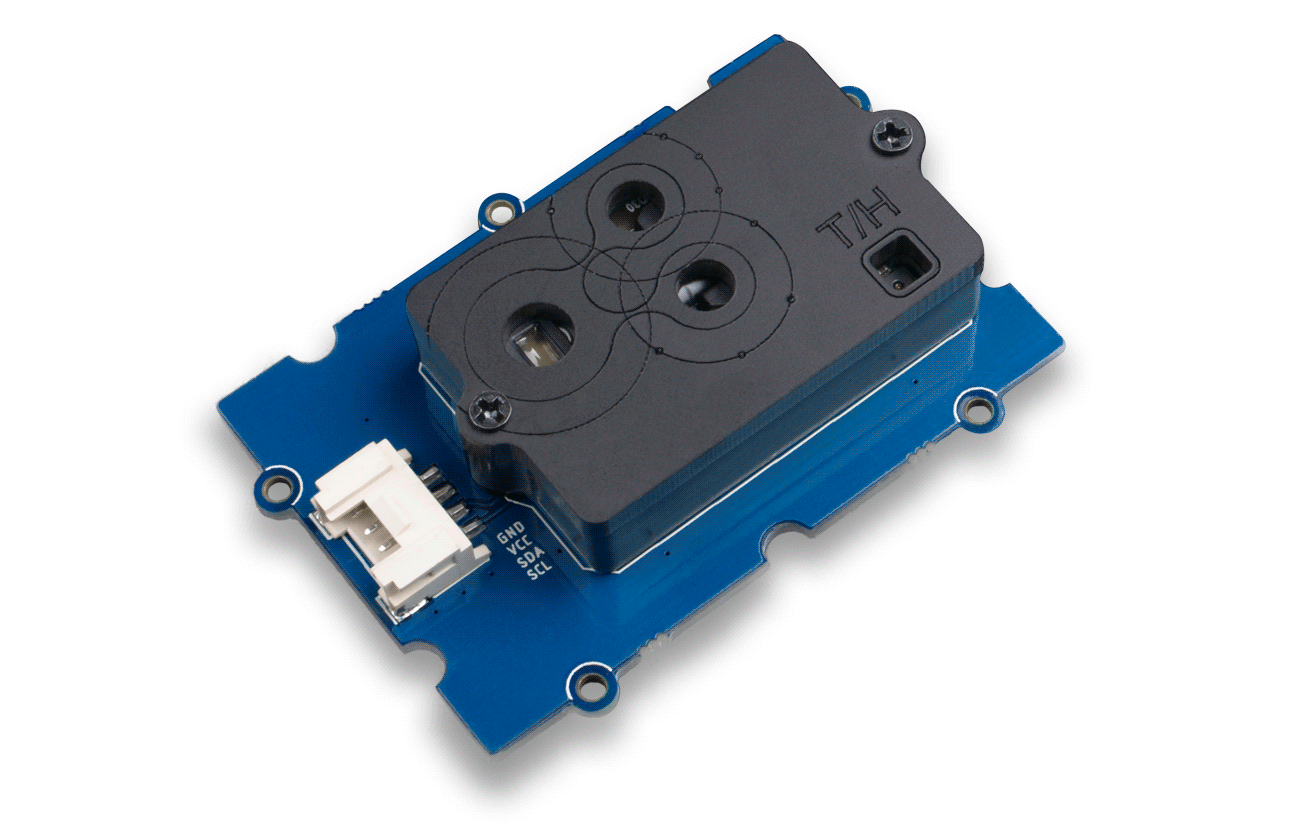
The Grove – CO2 & Temperature & Humidity Sensor (SCD30) is a high precision carbon dioxide sensor, which is based on Sensirion SCD30. The measuring range of this sensor is 0 ppm-40’000 ppm, and the measurement accuracy can reach to ±(30 ppm + 3%) between 400ppm to 10’000ppm.
In addition to the Non-Dispersive Infrared (NDIR) measurement technology for CO2 detection, the SCD30 integrates Sensirion humidity and temperature sensors on the same sensor module.
Features
NDIR CO2 sensor technology
Integrated temperature and humidity sensor
Best performance-to-price ratio
Dual-channel detection for superior stability
Digital interface I2C
Application Ideas
Specifications
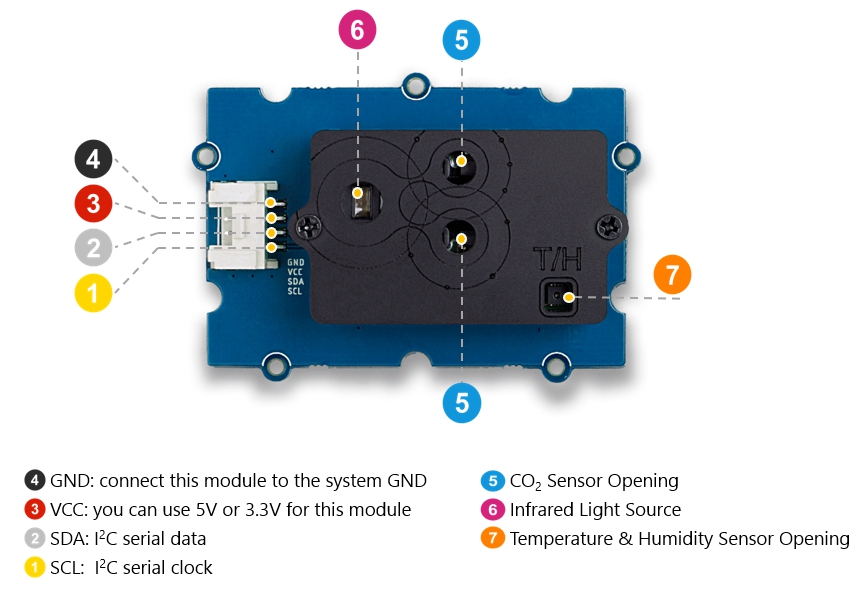
Supply voltage: 3.3V / 5V
Operating temperature: 0 – 50℃
Storage temperature: – 40°C – 70°C
Humidity operating conditions: 0 – 95 %RH
Sensor lifetime: 15 years
Interface: I2C
I2C Address: 0x61
Pinout
Applications
Air Purifier
Environmental Monitoring
Plant Environmental Monitoring
The sensor is available for $59.95 at www.seeedstudio.com and you can find more information in the Wiki.